UNITED STATES
SECURITIES AND EXCHANGE COMMISSION
Washington, DC 20549
FORM 10-Q
(Mark One)
| QUARTERLY REPORT PURSUANT TO SECTION 13 or 15(d) OF THE SECURITIES EXCHANGE ACT OF 1934 | |||||
For the quarterly period ended September 30, 2025
OR
| TRANSITION REPORT PURSUANT TO SECTION 13 or 15(d) OF THE SECURITIES EXCHANGE ACT OF 1934 | |||||
For the transition period from to
Commission File Number: 000-56717
(Exact name of registrant as specified in its charter)
(State or other jurisdiction of incorporation or organization) | (I.R.S. Employer Identification No.) | ||||
| (Address of principal executive offices) | (Zip Code) | ||||
(817 ) 871-4000
(Registrant’s telephone number, including area code)
Securities registered pursuant to Section 12(b) of the Act:
| Title of each class | Trading Symbol(s) | Name of each exchange on which registered | ||||||||||||
| None | ||||||||||||||
Indicate by check mark whether the registrant (1) has filed all reports required to be filed by Section 13 or 15(d) of the Securities Exchange Act of 1934 during the preceding 12 months (or for such shorter period that the registrant was required to file such reports), and (2) has been subject to such filing requirements for the past 90 days. Yes x No o
Indicate by check mark whether the registrant has submitted electronically every Interactive Data File required to be submitted pursuant to Rule 405 of Regulation S-T (§232.405 of this chapter) during the preceding 12 months (or for such shorter period that the registrant was required to submit such files). Yes x No o
Indicate by check mark whether the registrant is a large accelerated filer, an accelerated filer, a non-accelerated filer, a smaller reporting company, or an emerging growth company. See the definitions of “large accelerated filer,” “accelerated filer,” “smaller reporting company,” and “emerging growth company” in Rule 12b-2 of the Exchange Act.
| Large accelerated filer | o | Accelerated filer | o | |||||||||||
| x | Smaller reporting company | |||||||||||||
| Emerging growth company | ||||||||||||||
If an emerging growth company, indicate by check mark if the registrant has elected not to use the extended transition period for complying with any new or revised financial accounting standards provided pursuant to Section 13(a) of the Exchange Act. o
Indicate by check mark whether the registrant is a shell company (as defined in Rule 12b-2 of the Exchange Act). Yes o No x
As of November 10, 2025, the Registrant had the following limited partnership units outstanding: 16,034,840 units of Class R-I, 9,742,645 units of Class R-S, 170,356 units of Class R-D, and 969,858 units of Class F.
TABLE OF CONTENTS
| Financial Statements | ||||||||
Condensed Consolidated Statements of Assets and Liabilities as of September 30, 2025 (Unaudited) and December 31, 2024 | ||||||||
Condensed Consolidated Statements of Operations for the Three and Nine Months Ended September 30, 2025 (Unaudited) | ||||||||
Condensed Consolidated Statements of Changes in Net Assets for the Three and Nine Months Ended September 30, 2025 (Unaudited) | ||||||||
Condensed Consolidated Statement of Cash Flows for the Nine Months Ended September 30, 2025 (Unaudited) | ||||||||
Condensed Consolidated Schedule of Investments as of September 30, 2025 (Unaudited) | ||||||||
| Notes to Condensed Consolidated Financial Statements (Unaudited) | ||||||||
| Management’s Discussion and Analysis of Financial Condition and Results of Operations | ||||||||
| Quantitative and Qualitative Disclosures About Market Risk | ||||||||
| Controls and Procedures | ||||||||
| Legal Proceedings | ||||||||
| Risk Factors | ||||||||
| Unregistered Sales of Equity Securities and Use of Proceeds | ||||||||
| Defaults Upon Senior Securities | ||||||||
| Mine Safety Disclosures | ||||||||
| Other Information | ||||||||
| Exhibits | ||||||||
TERMS USED IN THIS REPORT
As used in this Quarterly Report on Form 10-Q, unless the context otherwise requires, references to:
•the term “Aggregator” refers to T-POP US Aggregator (CYM), L.P., a Cayman Islands exempted limited partnership, in which the Registrant (as defined below) and other parallel investment entities (“Parallel Investment Entities”) invest;
•the term “Registrant” refers to TPG Private Equity Opportunities, L.P., a Delaware limited partnership, which is generally being offered to U.S. taxable investors, and that invests all or substantially all of its assets in the Aggregator;
•the term “Feeder TE” refers to TPG Private Equity Opportunities (TE), L.P., a Delaware limited partnership, which is generally being offered to non-U.S. investors and U.S. tax-exempt investors, and that invests all or substantially all of its assets indirectly in Class R-I Units (as defined below) of the Registrant;
•the terms “Fund” and “T-POP” refer to the Registrant and its consolidated subsidiaries including the Aggregator;
•the term “Fund Complex” refers collectively to the Registrant, the Parallel Investment Entities and the Aggregator;
•the term “General Partner” refers to TPG Private Equity Opportunities GenPar, L.P., a Delaware limited partnership, as the general partner of each Partnership;
•the term “Limited Partners” refers to the limited partners of T-POP, and references to the “applicable Partnership” mean that particular Partnership in which such Limited Partner invests and, unless the context otherwise requires, any subsidiaries thereof;
•the term “Management Company” refers to T-POP Management Company, LLC, a Delaware limited liability company which is responsible for portfolio management for the Fund;
•The term “Transactional NAV” refers to the price at which transactions in the Fund’s Units (as defined below) are made (as the context requires), calculated in accordance with a valuation policy that has been approved by the Registrant’s board of directors (“Board of Directors” or “Board”).
•the terms “TPG” and “Firm” refer collectively to TPG Operating Group I, L.P., TPG Operating Group II, L.P., TPG Operating Group III, L.P. (collectively, “TPG Operating Group”) and Angelo, Gordon & Co., L.P. and their controlled funds, general partners and management companies and any of their affiliates, including TPG Inc.;
•the term “Units” refers to the classes of the Fund’s limited partnership units: Class S (“Class S” or the “Class S Units”), Class D (“Class D” or the “Class D Units”), Class I (“Class I” or the “Class I Units”), Class R-S (“Class R-S” or the “Class R-S Units”), Class R-D (“Class R-D” or the “Class R-D Units”), and Class R-I (“Class R-I” or the “Class R-I Units”) and Class F (“Class F” or the “Class F Units”) (each a “Class”); and
•the term “Investor Units” refers to Class S, Class D, Class I, Class R-S, Class R-D, Class R-I collectively.
The Registrant is an emerging growth company as defined in the Jumpstart Our Business Startups Act of 2012 (the “JOBS Act”) and the Registrant takes advantage of the extended transition period provided in Section 7(a)(2)(B) of the Securities Act of 1933, as amended (the “1933 Act”).
Cautionary Note Regarding Forward-Looking Statements
This Quarterly Report on Form 10-Q may contain forward-looking statements within the meaning of Section 27A of the 1933 Act, and Section 21E of the Securities Exchange Act of 1934, as amended (the “Exchange Act”), which involve certain known and unknown risks and uncertainties. Forward-looking statements predict or describe the Funds’ future operations, business plans, business and investment strategies and portfolio management and the performance of the Fund’s investments. These forward-looking statements are generally identified by their use of such terms and phrases as “intend,” “goal,” “estimate,” “expect,” “remain,” “project,” “projections,” “plans,” “seeks,” “anticipates,” “will,” “should,” “could,” “may,” “designed to,” “foreseeable future,” “believe,” “scheduled” and similar expressions. The Fund’s actual results or outcomes may differ materially from those anticipated. You are cautioned not to place undue reliance on these forward-looking statements, which speak only as of the date the statement was made. Potential investors should not rely on these statements as if they were fact. The Fund assumes no obligation to publicly update or revise any forward-looking statements, whether as a result of new information, future events or otherwise, except as required by law. The forward-looking statements contained in this Quarterly Report on Form 10-Q may include statements as to:
•the Fund’s business prospects and the prospects of the portfolio companies the Fund owns and controls;
•the impact of the acquisitions of investments that the Fund expects to make;
•the Fund’s ability to raise sufficient capital to execute our acquisition strategies;
•the ability of the Management Company to source adequate investment acquisition opportunities to efficiently deploy capital;
•the ability of the Fund’s portfolio companies to achieve their objectives;
•the Fund’s current and expected financing arrangements;
•changes in the general interest rate environment;
•the adequacy of the Fund’s cash resources, financing sources and working capital;
•the timing and amount of cash flows, distributions and dividends, if any, from the Fund’s portfolio companies;
•the Fund’s contractual arrangements and relationships with third parties;
•actual and potential conflicts of interest with the Management Company or any of its affiliates;
•the dependence of the Fund’s future success on the general economy and its effect on the industries in which the Fund owns and controls portfolio companies;
•the Fund’s use of financial leverage;
•the ability of the Management Company to identify, acquire and support the Fund’s portfolio companies;
•the ability of the Management Company or its affiliates to attract and retain highly talented professionals;
•the Fund’s ability to structure acquisitions and joint ventures in a tax-efficient manner and the effect of changes to tax legislation and its tax position; and
•the tax status of the enterprises through which the Fund owns and controls portfolio companies.
Although the Fund believes that the assumptions on which these forward-looking statements are based are reasonable, any of those assumptions could prove to be inaccurate, and as a result, the forward-looking statements based on those assumptions also could be inaccurate. In light of these and other uncertainties, the inclusion of any projection or forward-looking statement in this Quarterly Report on Form 10-Q should not be regarded as a representation by the Fund that its plans and objectives will be achieved. These risks and uncertainties include, but are not limited to, those described or identified in the section entitled “Item 1A. Risk Factors” in Amendment No. 1 to the Registrant’s Form 10 Registration Statement filed with the SEC on February 19, 2025 (the “Form 10 Registration Statement”) and the Registrant’s Quarterly Report on Form 10-Q for the quarter ended March 31, 2025 filed with the SEC on May 13, 2025, as such factors may be updated from time to time in the Registrant’s periodic filings with the SEC, which are accessible on the SEC’s website at https://www.sec.gov.
Moreover, the Fund assumes no duty and does not undertake to update the forward-looking statements, except as required by applicable law.
PART I - FINANCIAL INFORMATION
ITEM 1. FINANCIAL STATEMENTS
TPG Private Equity Opportunities, L.P.
Condensed Consolidated Statements of Assets and Liabilities (Unaudited)
(Dollars in Thousands, Except Unit Data)
| September 30, 2025 | December 31, 2024 | ||||||||||
| Assets | |||||||||||
Investments at Fair Value (Cost $ | $ | $ | |||||||||
Investments in Affiliated Investee Funds at Fair Value (Cost $ | |||||||||||
| Derivative Assets at Fair Value | |||||||||||
| Cash Equivalents | |||||||||||
| Dividends Receivable | |||||||||||
| Deferred Offering Costs | |||||||||||
| Other Assets | |||||||||||
| Total Assets | $ | ||||||||||
| Liabilities | |||||||||||
| Derivative Liabilities at Fair Value | $ | $ | |||||||||
| Organizational and Offering Costs Payable | |||||||||||
| Servicing Fees Payable | |||||||||||
| Accrued Performance Participation Allocation | |||||||||||
| Deferred Tax Liability | |||||||||||
| Maintenance Fee Payable | |||||||||||
| Professional Fees Payable | |||||||||||
| Payable for Investments Purchased | |||||||||||
| Other Liabilities | |||||||||||
| Total Liabilities | |||||||||||
| Commitments and Contingencies (Note 8) | |||||||||||
| Net Assets | |||||||||||
Limited Partnership Units - Class R-D, unlimited Units authorized, ( | |||||||||||
Limited Partnership Units - Class R-S, unlimited Units authorized, ( | |||||||||||
Limited Partnership Units - Class R-I, unlimited Units authorized, ( | |||||||||||
Limited Partnership Units - Class F, unlimited Units authorized, ( | |||||||||||
| General Partner Interest | |||||||||||
| Limited Partner Interest | |||||||||||
| Non-Controlling Interests | |||||||||||
| Total Net Assets | |||||||||||
| Total Liabilities and Net Assets | $ | $ | |||||||||
See accompanying notes to Condensed Consolidated Financial Statements.
2
TPG Private Equity Opportunities, L.P.
Condensed Consolidated Statements of Operations (Unaudited)
(Dollars in Thousands)
| Three Months Ended September 30, | Nine Months Ended September 30, | ||||||||||
| 2025 | 2025 | ||||||||||
| Revenues | |||||||||||
| Dividend Income | $ | $ | |||||||||
| Interest Income | |||||||||||
| Total revenues | |||||||||||
| Expenses | |||||||||||
| Organizational Expenses | |||||||||||
| Performance Participation Allocation | |||||||||||
| Deferred Offering Costs Amortization | |||||||||||
| Maintenance Fees | |||||||||||
| Professional Fees | |||||||||||
| Other Expenses | |||||||||||
| Total expenses | |||||||||||
| Net Investment Income (Loss) | ( | ( | |||||||||
| Net Change in Unrealized Gain (Loss) on Investments and Derivative Contracts | |||||||||||
| Net Change in Unrealized Gain (Loss) on Investments | |||||||||||
| Net Change in Unrealized Gain (Loss) on Derivative Contracts | ( | ( | |||||||||
| Total Net Change in Unrealized Gain (Loss) | |||||||||||
| Provision for Income Taxes | ( | ( | |||||||||
| Net Increase in Net Assets Resulting from Operations | $ | $ | |||||||||
| Net Increase in Net Assets Resulting from Operations Attributable to Non-Controlling Interests | $ | $ | |||||||||
| Net Increase in Net Assets Resulting from Operations Attributable to T-POP | $ | $ | |||||||||
See accompanying notes to Condensed Consolidated Financial Statements.
3
TPG Private Equity Opportunities, L.P.
Condensed Consolidated Statements of Changes in Net Assets (Unaudited)
(Dollars in Thousands)
| Class R-S Units | Class R-D Units | Class R-I Units | Class F Units | Non-Controlling Interests | Total Net Assets | |||||||||||||||||||||||||||||||||
| Balance at June 30, 2025 | $ | $ | $ | $ | $ | $ | ||||||||||||||||||||||||||||||||
| Proceeds from Units Issued | ||||||||||||||||||||||||||||||||||||||
| Net Investment Income (Loss) | ( | ( | ( | ( | ( | ( | ||||||||||||||||||||||||||||||||
| Provision for Income Taxes | ( | ( | ( | ( | ( | ( | ||||||||||||||||||||||||||||||||
| Net Change in Unrealized Gain (Loss) on Investments | ||||||||||||||||||||||||||||||||||||||
| Net Change in Unrealized Gain (Loss) on Derivative Contracts | ( | ( | ( | |||||||||||||||||||||||||||||||||||
| Servicing Fees | ( | ( | ( | |||||||||||||||||||||||||||||||||||
| Balance at September 30, 2025 | $ | $ | $ | $ | $ | $ | ||||||||||||||||||||||||||||||||
| Class R-S Units | Class R-D Units | Class R-I Units | Class F Units | Non-Controlling Interests | Total Net Assets | |||||||||||||||||||||||||||||||||
| Balance at December 31, 2024 | $ | $ | $ | $ | $ | |||||||||||||||||||||||||||||||||
| Proceeds from Units Issued | ||||||||||||||||||||||||||||||||||||||
| Net Investment Income (Loss) | ( | ( | ( | ( | ( | ( | ||||||||||||||||||||||||||||||||
| Provision for Income Taxes | ( | ( | ( | ( | ( | ( | ||||||||||||||||||||||||||||||||
| Net Change in Unrealized Gain (Loss) on Investments | ||||||||||||||||||||||||||||||||||||||
| Net Change in Unrealized Gain (Loss) on Derivative Contracts | ( | ( | ( | ( | ( | |||||||||||||||||||||||||||||||||
| Servicing Fees | ( | ( | ( | |||||||||||||||||||||||||||||||||||
| Balance at September 30, 2025 | $ | $ | $ | $ | $ | $ | ||||||||||||||||||||||||||||||||
See accompanying notes to Condensed Consolidated Financial Statements.
4
TPG Private Equity Opportunities, L.P.
Condensed Consolidated Statement of Cash Flows (Unaudited)
(Dollars in Thousands)
| Nine Months Ended September 30, 2025 | |||||
| Operating Activities: | |||||
| Net Increase in Net Assets Resulting from Operations | $ | ||||
| Adjustments to Reconcile Net Increase in Net Assets From Operations to Net Cash Used in Operating Activities: | |||||
| Net Change in Unrealized (Gain) / Loss on Investments | ( | ||||
| Net Change in Unrealized (Gain) / Loss on Derivative Contracts | |||||
| Interest Income Received In-Kind | ( | ||||
| Amortization of Deferred Offering Costs | |||||
| Class F Units Issued as Payment of Directors' Fees | |||||
| Purchases of Investments | ( | ||||
| Proceeds From Sales of Investments | |||||
| Cash Flows due to Changes in Operating Assets and Liabilities: | |||||
| (Increase) in Dividends Receivable | ( | ||||
| (Increase) in Deferred Offering Costs | ( | ||||
| (Increase) in Other Assets | ( | ||||
| Increase in Organizational and Offering Costs Payable | |||||
| Increase in Accrued Performance Participation Allocation | |||||
| Increase in Deferred Tax Liability | |||||
| Increase in Maintenance Fee Payable | |||||
| Increase in Professional Fees Payable | |||||
| Increase in Other Liabilities | |||||
| Net Cash Used in Operating Activities | $ | ( | |||
| Financing Activities: | |||||
| Proceeds from issuance of units | $ | ||||
| Payment of servicing fees | ( | ||||
| Net Cash Provided by Financing Activities | $ | ||||
| Net Increase in Cash Equivalents | $ | ||||
| Cash Equivalents, Beginning of Period | |||||
| Cash Equivalents, End of Period | $ | ||||
| Supplemental Disclosure of Non-Cash Financing Activities: | |||||
| Servicing Fees Payable | $ | ||||
| Units Issued in Exchange for Investments | $ | ||||
See accompanying notes to Condensed Consolidated Financial Statements.
5
TPG Private Equity Opportunities, L.P.
Condensed Consolidated Schedule of Investments (Unaudited)
As of September 30, 2025
(Dollars in Thousands)
| Issuer | Asset | Core Sector | Geography(a) | Valuation Level | Fair Value ($) | Fair Value as Percentage of Net Assets (%) | ||||||||||||||||||||||||||||||||
| Portfolio Companies | ||||||||||||||||||||||||||||||||||||||
| Consumer Services | ||||||||||||||||||||||||||||||||||||||
Other Investment in Portfolio Company(c) | Consumer | N. America | Level III | $ | % | |||||||||||||||||||||||||||||||||
| Total Consumer Services | % | |||||||||||||||||||||||||||||||||||||
| Energy Transition | ||||||||||||||||||||||||||||||||||||||
Other Investment in Portfolio Company(c) | Energy Transition | N. America | Level III | % | ||||||||||||||||||||||||||||||||||
| Total Energy Transition | % | |||||||||||||||||||||||||||||||||||||
| Financial Services | ||||||||||||||||||||||||||||||||||||||
| Creative Planning | Equity interest held through TPG IX Cardiff CI II, L.P. ( | Business Services | N. America | Level III | % | |||||||||||||||||||||||||||||||||
Other Investments in Portfolio Companies(c) | Business Services | N. America | Level III | % | ||||||||||||||||||||||||||||||||||
| Total Financial Services | % | |||||||||||||||||||||||||||||||||||||
| Health Care Equipment & Services | ||||||||||||||||||||||||||||||||||||||
| Surescripts | Equity interest held through TPG Starman Investment Holdings I, L.P. and TPG Starman Investment Holdings II, L.P. | Healthcare | N. America | Level III | % | |||||||||||||||||||||||||||||||||
Other Investments in Portfolio Companies(c) | Healthcare | N. America | Level III | % | ||||||||||||||||||||||||||||||||||
Other Investments in Portfolio Companies(c) | Healthcare | Asia | Level III | % | ||||||||||||||||||||||||||||||||||
| Total Health Care Equipment & Services | % | |||||||||||||||||||||||||||||||||||||
See accompanying notes to Condensed Consolidated Financial Statements.
6
TPG Private Equity Opportunities, L.P.
Condensed Consolidated Schedule of Investments (Unaudited)—Continued
As of September 30, 2025
(Dollars in Thousands)
| Issuer | Asset | Core Sector | Geography(a) | Valuation Level | Fair Value ($) | Fair Value as Percentage of Net Assets (%) | ||||||||||||||||||||||||||||||||
| Media & Entertainment | ||||||||||||||||||||||||||||||||||||||
Other Investment in Portfolio Company(c) | Technology | N. America | Level III | % | ||||||||||||||||||||||||||||||||||
| Total Media & Entertainment | % | |||||||||||||||||||||||||||||||||||||
| Pharmaceuticals, Biotechnology & Life Sciences | ||||||||||||||||||||||||||||||||||||||
Novotech | Equity interest held through TPG Kepler HoldCo Pte. Ltd. ( | Business Services | Asia | Level III | % | |||||||||||||||||||||||||||||||||
| Total Pharmaceuticals, Biotechnology & Life Sciences | % | |||||||||||||||||||||||||||||||||||||
| Software & Services | ||||||||||||||||||||||||||||||||||||||
| Hospitality Solutions | Equity interest held through TPG IX Whitney Holdings Aggregation, L.P. ( | Technology | N. America | Level III | % | |||||||||||||||||||||||||||||||||
Other Investments in Portfolio Companies(c) | Technology | N. America | Level III | % | ||||||||||||||||||||||||||||||||||
Other Investment in Portfolio Company(c) | Technology | Europe | Level III | % | ||||||||||||||||||||||||||||||||||
Other Investment in Portfolio Company(c) | Technology | Asia | Level III | % | ||||||||||||||||||||||||||||||||||
| Total Software & Services | % | |||||||||||||||||||||||||||||||||||||
| Utilities | ||||||||||||||||||||||||||||||||||||||
Other Investment in Portfolio Company(c) | Energy Transition | Europe | Level III | % | ||||||||||||||||||||||||||||||||||
| Total Utilities | % | |||||||||||||||||||||||||||||||||||||
Total Portfolio Companies (Cost $ | % | |||||||||||||||||||||||||||||||||||||
See accompanying notes to Condensed Consolidated Financial Statements.
7
TPG Private Equity Opportunities, L.P.
Condensed Consolidated Schedule of Investments (Unaudited)—Continued
As of September 30, 2025
(Dollars in Thousands)
| Issuer | Asset | Core Sector | Geography(a) | Valuation Level | Fair Value ($) | Fair Value as Percentage of Net Assets (%) | ||||||||||||||||||||||||||||||||
| Unaffiliated Investee Funds | ||||||||||||||||||||||||||||||||||||||
| Consumer Services | ||||||||||||||||||||||||||||||||||||||
Other Investment in Unaffiliated Investee Fund(c) | Consumer | N. America | NAV | % | ||||||||||||||||||||||||||||||||||
Other Investment in Unaffiliated Investee Fund(c) | Consumer | Asia | NAV | % | ||||||||||||||||||||||||||||||||||
| Total Consumer Services | % | |||||||||||||||||||||||||||||||||||||
| Health Care Equipment & Services | ||||||||||||||||||||||||||||||||||||||
Other Investment in Unaffiliated Investee Fund(c) | Healthcare | Europe | NAV | % | ||||||||||||||||||||||||||||||||||
| Total Health Care Equipment & Services | % | |||||||||||||||||||||||||||||||||||||
| Software & Services | ||||||||||||||||||||||||||||||||||||||
Other Investments in Unaffiliated Investee Funds(c) | Technology | N. America | NAV | % | ||||||||||||||||||||||||||||||||||
| Total Software & Services | % | |||||||||||||||||||||||||||||||||||||
Total Unaffiliated Investee Funds (Cost $ | % | |||||||||||||||||||||||||||||||||||||
Debt Investments(b) | ||||||||||||||||||||||||||||||||||||||
| Software & Services | ||||||||||||||||||||||||||||||||||||||
Other Investment in Debt(c) | Technology | Asia | Level III | % | ||||||||||||||||||||||||||||||||||
| Total Software & Services | % | |||||||||||||||||||||||||||||||||||||
Total Debt Investments (Cost $ | % | |||||||||||||||||||||||||||||||||||||
Total Investments (Cost $ | % | |||||||||||||||||||||||||||||||||||||
See accompanying notes to Condensed Consolidated Financial Statements.
8
TPG Private Equity Opportunities, L.P.
Condensed Consolidated Schedule of Investments (Unaudited)—Continued
As of September 30, 2025
(Dollars in Thousands)
| Issuer | Asset | Core Sector | Geography(a) | Valuation Level | Fair Value ($) | Fair Value as Percentage of Net Assets (%) | ||||||||||||||||||||||||||||||||
| Affiliated Investee Funds | ||||||||||||||||||||||||||||||||||||||
| Financial Services | ||||||||||||||||||||||||||||||||||||||
| Growth VI | Equity interest held through TPG Growth VI CS, L.P. | Various | N. America | NAV | % | |||||||||||||||||||||||||||||||||
| Total Financial Services | % | |||||||||||||||||||||||||||||||||||||
| GP-Led Secondaries | ||||||||||||||||||||||||||||||||||||||
Other Investment in Affiliated Investee Fund(c) | Various | N. America | NAV | % | ||||||||||||||||||||||||||||||||||
| Total GP-Led Secondaries | % | |||||||||||||||||||||||||||||||||||||
Total Affiliated Investee Funds (Cost $ | % | |||||||||||||||||||||||||||||||||||||
| Derivative Instruments | ||||||||||||||||||||||||||||||||||||||
| Derivative Asset | % | |||||||||||||||||||||||||||||||||||||
| Derivative Liability | ( | ( | % | |||||||||||||||||||||||||||||||||||
Total Derivative Instruments (Cost $ | ( | ( | % | |||||||||||||||||||||||||||||||||||
| Cash Equivalents | ||||||||||||||||||||||||||||||||||||||
Dreyfus Government Cash Management, | N. America | % | ||||||||||||||||||||||||||||||||||||
Total Cash Equivalents (Cost $ | % | |||||||||||||||||||||||||||||||||||||
Total Investments, Investments in Affiliated Investee Funds, Derivative Instruments, and Cash Equivalents (Cost $ | $ | % | ||||||||||||||||||||||||||||||||||||
_______________
a.Europe includes Europe and Middle East; Asia includes Asia and Australia.
b.Debt includes different forms of interests that represent a creditor relationship with an investee, including bank loans.
c.There were no single investments included in this category that exceeded 5 % of net assets.
See accompanying notes to Condensed Consolidated Financial Statements.
9
TPG Private Equity Opportunities, L.P.
Notes to Condensed Consolidated Financial Statements (Unaudited)
(All Dollars are in Thousands, Except Unit and Per Unit Data, Except Where Noted)
1. Organization
TPG Private Equity Opportunities, L.P. along with its consolidated subsidiaries (collectively “T-POP” or the “Fund”) is a Delaware limited partnership formed on August 30, 2024 as a private fund exempt from registration under Section 3(c)(7) of the Investment Company Act of 1940, as amended (the “1940 Act”). T-POP’s investment objective is to generate investment returns by providing its Limited Partners with broad exposure to investments across the private equity strategies of TPG Inc. (“TPG”). Structured as a perpetual life investment solution, T-POP accepts fully funded subscriptions monthly and aims to provide limited partners a liquidity option by means of a quarterly redemption program.
T-POP conducts a continuous private offering of its units in reliance on exemptions from the registration requirements of the Securities Act of 1933, as amended (“1933 Act”), to investors that are both (a) accredited investors (as defined in Regulation D under the 1933 Act) and (b) qualified purchasers (as defined in the 1940 Act and the rules thereunder).
TPG Private Equity Opportunities (TE) L.P. (the “Feeder”), a Delaware limited partnership, invests all or substantially all of its assets in T-POP. The Feeder was established for certain investors with particular tax characteristics, such as tax-exempt investors and certain non-U.S. investors.
Investment operations commenced on June 2, 2025 (the “Commencement Date” or “Initial Closing Date”), when T-POP first sold Units in its continuous private offering and began investing. T-POP’s fiscal year-end is December 31.
TPG Private Equity Opportunities GenPar, L.P., a Delaware limited partnership, serves as T-POP’s general partner (the “General Partner”). Overall responsibility for oversight of T-POP rests with the General Partner, subject to certain oversight rights held by T-POP’s board of directors. The General Partner delegates T-POP’s portfolio management function to T-POP Management Company, LLC (the “Management Company”), a Delaware limited liability company. The Management Company has discretion to make investments on behalf of T-POP and is responsible for initiating, structuring and negotiating T-POP’s investments, as well as actively managing each investment to seek to maximize value. Both the General Partner and Management Company are subsidiaries of TPG.
2. Summary of Significant Accounting Policies
Basis of Presentation
The accompanying unaudited condensed consolidated financial statements (the “Condensed Consolidated Financial Statements”) of T-POP have been prepared in accordance with accounting principles generally accepted in the United States of America (“U.S. GAAP”) and reflect all adjustments, consisting only of normal recurring adjustments, which are, in the opinion of management, necessary for a fair presentation of T-POP’s Condensed Consolidated Financial Statements. T-POP is considered an investment company under U.S. GAAP and follows the accounting and reporting guidance applicable to investment companies in the Financial Accounting Standards Board Accounting Standards Codification (“ASC”) Topic 946, Financial Services-Investment Companies (“ASC 946”).
Basis of Consolidation
Non-Controlling Interests
10
TPG Private Equity Opportunities, L.P.
Notes to Condensed Consolidated Financial Statements (Unaudited)
(All Dollars are in Thousands, Except Unit and Per Unit Data, Except Where Noted)
Use of Estimates
The preparation of the Condensed Consolidated Financial Statements in accordance with U.S. GAAP requires management to make estimates and assumptions that affect the reported amounts of assets and liabilities and the disclosure of contingent assets and liabilities at the date of the financial statements and the reported amounts of income and expenses during the reporting period. Actual results could differ from those estimates and such differences could be material to the Condensed Consolidated Financial Statements.
Cash Equivalents
Foreign Currency
Assets and liabilities denominated in foreign currencies are translated into U.S. dollar amounts at the reporting date. Transactions denominated in foreign currencies, including purchases and sales of investments, and income and expenses, are translated into U.S. dollar amounts on the date of such transactions and are included in Net Unrealized Gain (Loss) on Investments on the Condensed Consolidated Statements of Operations. The Fund's investments may be denominated in foreign currencies and, thus, are subject to foreign currency exchange rate fluctuations. Investments are translated into U.S. dollar amounts at the reporting date and the adjustment is included in Investments, at Fair Value and Net Change in Unrealized Gain (Loss) on Investments in the Condensed Consolidated Statements of Operations.
Fair Value Measurement
ASC Topic 820, Fair Value Measurement (“ASC 820”) establishes a hierarchy that prioritizes and ranks the level of observability of inputs used to measure investments at fair value. The observability of inputs is impacted by a number of factors, including the type of investment to which it relates, the investment’s characteristics, market conditions and other factors. The hierarchy gives the highest priority to unadjusted quoted prices in active markets for identical assets or liabilities (Level I inputs) and the lowest priority to unobservable inputs (Level III inputs).
Financial instruments with readily available quoted prices or for which fair value can be measured from quoted prices in active markets will typically have a higher degree of input observability and therefore require a lesser degree of judgment applied in determining their fair value.
The three levels of ASC 820’s fair value hierarchy are as follows:
•Level I - Quoted prices (unadjusted) in active markets for identical financial instruments at the measurement date are used. The type of investments generally included in Level I are publicly listed securities in an active market and investments in money market funds.
•Level II - Pricing inputs are other than quoted prices within Level I that are observable for the financial instrument, either directly or indirectly. Level II pricing inputs include quoted prices for similar financial instruments in active markets, quoted prices for identical or similar instruments in markets that are not active, inputs other than quoted prices that are observable for the instrument, and inputs that are derived principally from or corroborated by observable market data by correlation or other means. The types of financial instruments generally classified in this category include securities with less liquidity traded in active markets, securities traded in other than active markets, corporate bonds and loans, foreign currency forward contracts and government and agency securities.
•Level III - Pricing inputs are unobservable and include situations where there is little, if any, market activity for the financial instrument. The inputs into the determination of fair value require significant judgment and estimation. The types of instruments generally included in Level III are privately held debt and equity securities.
11
TPG Private Equity Opportunities, L.P.
Notes to Condensed Consolidated Financial Statements (Unaudited)
(All Dollars are in Thousands, Except Unit and Per Unit Data, Except Where Noted)
In some cases, the inputs used to measure fair value may fall into different levels of the fair value hierarchy. In such cases, the level in the fair value hierarchy within which the fair value measurement in its entirety falls has been determined based on the lowest level input (with Level III being the lowest) that is significant to the fair value measurement in its entirety. Assessing the significance of a particular input to the fair value measurement in its entirety requires judgment and consideration of factors specific to the financial instrument. The categorization of an instrument within the hierarchy is based upon the pricing transparency of the instrument and does not necessarily correspond to the perceived risk of that instrument.
Investments at Fair Value and Investments in Affiliated Investee Funds at Fair Value
T-POP values its investments at fair value in accordance with ASC 820. Fair value is the amount that would be received to sell an asset or paid to transfer a liability, in an orderly transaction between market participants at the measurement date. T-POP's investments are valued using valuation methodologies applied on a consistent basis as described below.
Fair Value of Investments or Instruments that are Exchange Traded
Securities that are exchange traded and for which a quoted market exists are valued at the closing price of such securities in the principal market in which the security trades, or in the absence of a principal market, in the most advantageous market on the valuation date. When a quoted price in an active market exists, no block discounts or control premiums are permitted regardless of the size of the public security held. In some cases, securities may include legal restrictions limiting their purchase and sale for a period of time, such as may be required under SEC Rule 144. A discount to the publicly traded price may be appropriate in those cases; the amount of the discount, if taken, shall be determined based on the time period that must pass before the restricted security becomes unrestricted or otherwise available for sale.
Fair Value of Investments or Instruments that are not Exchange Traded
In the absence of observable market prices, investment fair values are determined by applying methodologies on a consistent basis. For some investments little market activity may exist. The determination of fair value is then based on the best information available in the circumstances and may incorporate management’s own assumptions and involve a significant degree of judgment, taking into consideration a combination of internal and external factors, such as portfolio company performance and market and economic conditions. The Fund’s recent purchase transaction value may be a strong indicator of fair value and, as such, the Fund may continue to carry the investment at its transaction value for the first several reporting periods following the purchase of the investment, absent extraordinary factors. When the fair value is determined, it incorporates the latest available data, including values provided by external valuation firms, as well as any cash flow activity related to the investment during the month, updated quarterly financials, where applicable, and market movements. The methodology for determining the fair values of investments in operating companies may include either the income approach, market approach, or both:
•A market approach is a valuation technique that provides an estimation of the fair value of a business based on market prices in actual or anticipated transactions and on asking prices for similar businesses. The valuation process is based on a comparison and correlation between the subject company and other comparable companies, transactions, and/or market data points. Consideration is given to various factors, such as the nature of business and performance of the subject company including its key performance metrics to arrive at an estimation of the fair value of the subject company’s business.
▪The comparable company method is a valuation technique where reliance is placed on valuation multiples of comparable companies. Comparable companies are selected based on criteria such as, but not limited to, comparable industry and similar fundamentals and stage of development. Premiums or discounts may be applied to the comparable company’s multiples, if deemed reasonable, typically to calibrate the multiple to a recent deal price.
▪The comparable transaction method is a valuation technique where reliance is placed on valuation multiples from comparable transactions. Comparable transactions are selected based on criteria such as comparable industries, similar fundamentals, and stage of development, among other considerations.
12
TPG Private Equity Opportunities, L.P.
Notes to Condensed Consolidated Financial Statements (Unaudited)
(All Dollars are in Thousands, Except Unit and Per Unit Data, Except Where Noted)
•The income approach is a valuation technique that provides an estimation of the fair value of a business based on expectations about the cash flows expected to be derived from the business in the future. The income approach begins with an estimation of the annual cash flows expected to be generated over a discrete projection period, which are then converted to their present value equivalent using a rate of return appropriate for the risk of achieving the projected cash flows. Similarly, a residual value of the business, if any, is estimated beyond the discrete projection period and present valued to the valuation date. The aggregated present value of the estimated cash flows is then added to the present value equivalent of the residual value of the business to arrive at an estimate of fair value.
•Depending on the facts and circumstances associated with the investment, different methodologies may be used including option value, contingent claims or scenario analysis, yield analysis, projected cash flow through maturity or expiration, probability weighted methods or recent rounds of financing.
Fair Value of Fund Investments
Investments in affiliated or unaffiliated investee funds (“Investee Funds”) are generally valued using the reported net asset value (“NAV” or “Net Asset Value”) of the Investee Funds as a practical expedient for fair value. The Fund may, as a practical expedient, estimate the fair value of an Investee Fund based on NAV if the reported NAV of the Investee Fund is calculated in a manner consistent with the measurement principles of ASC 946 as of the reporting entity’s measurement date. T-POP has internal processes to independently evaluate the fair value measurement process utilized by the underlying Investee Fund to calculate the Investee Fund’s NAV, both of which are in accordance with ASC 946. Such internal processes include the evaluation of the Investee Fund’s own process and related internal controls in place to estimate the fair value of its underlying investments that are included in the NAV calculation, performing ongoing operational due diligence, review of the Investee Fund’s financial statements and ongoing monitoring of other relevant qualitative and quantitative factors. If T-POP determines, based on its own due diligence and investment monitoring procedures, that NAV does not represent fair value or if the investee fund is not an investment company, T-POP will estimate the fair value in good faith and in a manner that it reasonably chooses, in accordance with its valuation policies.
Debt and Other Securities
The fair values of certain debt positions are generally determined on the basis of prices between market participants provided by reputable dealers or pricing services. In determining the value of a particular investment, pricing services may use certain information with respect to transactions in such investments, quotations from dealers, pricing matrices, market transactions in comparable investments and various relationships between investments. Specifically, for investments in distressed debt and corporate loans and bonds, the Fund generally determines fair value by comparing against similar investments. The Fund reviews and analyzes prices obtained from external pricing sources to evaluate their reliability and accuracy, and at times, exclude vendor prices and broker quotations that the Fund does not believe are representative of fair value. Certain financial instruments may not trade or prices are not readily available, or trade infrequently and, when they are traded, the price may be unobservable and, as a result, multiple external pricing sources may not be available. In such instances, the Fund may use an internal pricing model as either a corroborating or sole data point in determining the price. The Fund generally engages specialized third-party valuation service providers to assess and corroborate the valuation of a selection of the investments on a periodic basis.
Income Taxes
T-POP is treated as a partnership for U.S. federal and state income tax purposes and is not subject to U.S. federal and state income tax. As a pass-through entity, each partner or member therein is responsible for income taxes related to income or loss based on their respective share of an entity’s income and expenses. It is possible that T-POP may be considered a publicly traded partnership and not meet the qualifying income exception in certain years. In such a scenario, T-POP would be treated as a publicly traded partnership taxed as a corporation, rather than a partnership. The investors of T-POP would be treated as shareholders in a corporation, and T-POP itself would become taxable as a corporation for U.S. federal, state and/or local income tax purposes. T-POP would be required to pay income tax at corporate rates on its net taxable income. In addition, T-POP intends to operate, in part, through subsidiaries that may be treated as corporations for U.S. and non-U.S. tax purposes and therefore may be subject to current and deferred U.S. federal, state and/or local income taxes at the subsidiary level.
13
TPG Private Equity Opportunities, L.P.
Notes to Condensed Consolidated Financial Statements (Unaudited)
(All Dollars are in Thousands, Except Unit and Per Unit Data, Except Where Noted)
Deferred Taxes
Uncertain Tax Positions
T-POP recognizes uncertain tax positions when it is more likely than not that the position will be sustained by the taxing authorities, based on the technical merits of the positions. The tax positions that meet the more-likely-than-not threshold are recognized based on the largest benefit that has a greater than 50% likelihood of being realized upon ultimate settlement. T-POP reevaluates its tax positions each period in which new information becomes available. T-POP’s policy is to recognize tax related interest and penalties, if applicable, as a component of the provision for income taxes on the Condensed Consolidated Statements of Operations.
Calculation of Net Asset Value
NAV under U.S. GAAP by unit class is calculated by subtracting total liabilities for each class from the total carrying amount of all assets for that class, which includes the fair value of investments. At the end of each month, any change in T-POP’s NAV (whether an increase or decrease) is allocated among each unit class based on the relative percentage of the previous aggregate NAV for each unit class, adjusted for issuances of units that were effective on the first calendar day of such month and repurchases that were effective on the last calendar day of such month. NAV per unit for each class is calculated by dividing the NAV for that class by the total number of outstanding units of that class on the reporting date. The Management Company is ultimately responsible for T-POP’s NAV calculations.
Revenue Recognition
Dividend income from our portfolio companies is recorded on the ex-dividend date, or, in the absence of a formal declaration of a record date, on the date when cash is received from the relevant portfolio company, but excludes any portion of distributions that are treated as a return of capital. Each distribution received from a portfolio company is evaluated to determine if the distribution should be recorded as dividend income or a return of capital. Distributions that are classified as a return of capital are recorded as a reduction in the cost basis of the investment. Dividend income from money market funds with financial institutions is recorded on an accrual basis to the extent that the Fund expects to collect such amounts.
Net Realized Gains or Losses and Net Change in Unrealized Gain (Loss) on Investments
Realized gains or losses will be measured as the difference between the net proceeds from the sale, repayment, or disposal of an asset and the adjusted cost basis of the asset. Net change in unrealized gain (loss) reflects the change in investment values during the reporting period, including any reversal of previously recorded unrealized gain or loss when gains or losses are realized. For the three and nine month period ended September 30, 2025, T-POP did not recognize any realized gains or losses.
Performance Participation Allocation
The General Partner, or any other entity designated by the General Partner, receives a performance participation allocation (“Performance Participation Allocation”) by T-POP equal to 12.5 % of total return subject to a 5 % annual hurdle amount and a highwater mark with a 100 % catch-up. The Performance Participation Allocation will be measured and distributed on a calendar year basis and accrued monthly (subject to pro-rating for partial periods), and without taking into account accrued and unpaid taxes of any intermediate entity through which T-POP indirectly invests in an investment or taxes paid by any such intermediate entity during the applicable period. The General Partner may elect to receive the
14
TPG Private Equity Opportunities, L.P.
Notes to Condensed Consolidated Financial Statements (Unaudited)
(All Dollars are in Thousands, Except Unit and Per Unit Data, Except Where Noted)
Performance Participation Allocation in cash, units and/or shares or units of intermediate entities. If the Performance Participation Allocation is paid in T-POP units, such units may be repurchased at the General Partner’s request and will be subject to certain limitations.
Derivative Instruments
T-POP enters into foreign currency forward contracts to hedge against foreign currency exchange rate risk on its non-U.S. dollar denominated securities or to facilitate settlement of foreign currency denominated transactions. A foreign currency forward contract is an agreement between two parties to buy and sell a currency at a set price with delivery and settlement at a future date. These contracts are marked-to-market by recognizing the difference between the contract forward exchange rate and the forward market exchange rate on the last day of the period as unrealized gains or losses. Unrealized gains and losses are presented net in Net Change in Unrealized Gain (Loss) on Derivative Contracts on the Condensed Consolidated Statements of Operations. When a foreign currency forward contract is closed, through either delivery or offset by entering into another foreign currency forward contract, T-POP recognizes realized gains or losses equal to the difference between the value of the contract at the time it was opened and the value of the contract at the time it was closed. Foreign currency forward contracts involve elements of market risk in excess of the amounts reflected on the Condensed Consolidated Statements of Assets and Liabilities. T-POP’s primary risk related to hedging is the risk of an unfavorable change in the foreign exchange rate underlying the foreign currency forward contract. Further information on derivative instruments can be found within Note 4 “Derivative Instruments”.
Organizational and Offering Expenses
Until the one-year anniversary of the Initial Closing, organization and offering expenses are paid by the Management Company. After T-POP accepted third party investors and commenced investment operations, all costs incurred associated with the organization of T-POP were expensed. Costs associated with the offering of Class S, Class R-S, Class D, Class R-D, Class I, Class R-I and Class F units of T-POP are capitalized as deferred expense and included as an asset on the Statements of Assets and Liabilities and amortized over a twelve-month period from June 2, 2025.
Servicing Fees
Pursuant to the Dealer Manager Agreement (the “Dealer Manager Agreement”) entered into between T-POP, the Feeder TE and TPG Capital BD, LLC (the “Dealer Manager”), T-POP or its affiliates will pay to the Dealer Manager a Servicing Fee (the “Servicing Fees”) in the amount of (a) 0.85 % per annum of the aggregate NAV for the Class S Units and Class R-S Units as of the last day of each month and (b) 0.25 % per annum of the aggregate NAV for the Class D Units and Class R-D Units as of the last day of each month, in each case, payable monthly. The Dealer Manager anticipates that all or a portion of the Servicing Fees will be retained by, or reallocated (paid) to, participating brokers or other financial intermediaries. T-POP or its affiliates will not pay to the Dealer Manager a Servicing Fee in respect of the purchase of any Class I Units, Class R-I Units and Class F Units. In calculating the Servicing Fee, T-POP will use its NAV before giving effect to any accruals for the Servicing Fee, repurchases for that month, if any, and distributions payable on the T-POP Units.
T-POP accrues the cost of the Servicing Fees, as applicable, for the estimated life of the units as an offering cost at the time we sell Class S Units, Class R-S Units, Class D Units, and Class R-D Units.
Segment Reporting
T-POP was established by TPG to provide eligible investors with access to TPG’s private equity franchise through a single investment. By leveraging the investment capabilities of TPG, T-POP aims to provide investors a pure play private equity alternative that benefits from TPG’s business building capabilities and strategic orientation towards attractive, growing sectors, and thereby serve as a core private equity allocation within its investors’ portfolios.
15
TPG Private Equity Opportunities, L.P.
Notes to Condensed Consolidated Financial Statements (Unaudited)
(All Dollars are in Thousands, Except Unit and Per Unit Data, Except Where Noted)
T-POP operates through a single reportable segment with an investment objective of generating investment returns by providing its Limited Partners with broad exposure to investments across the private equity strategies of TPG. The chief operating decision maker (the “CODM”) is T-POP’s Chief Executive Officer. The CODM assesses the performance of, allocates resources to and makes operating decisions for T-POP primarily based on T-POP’s Net Increase in Net Assets Resulting from Operations. As T-POP is a single segment, there is no difference between segment assets and total consolidated assets as presented on the Condensed Consolidated Statements of Assets and Liabilities and significant segment expenses are the same as those listed on the Condensed Consolidated Statements of Operations. As the Fund operates as a single segment, the accounting policies utilized by the segment are consistent with those included in the Condensed Consolidated Financial Statements here within.
3. Investments and Fair Value Measurement
The following table summarizes the valuation of the Fund’s investments, derivative assets and derivative liabilities held at fair value by the fair value hierarchy levels as of September 30, 2025:
| September 30, 2025 | |||||||||||||||||||||||||||||
| Level I | Level II | Level III | NAV | Total | |||||||||||||||||||||||||
| Assets | |||||||||||||||||||||||||||||
| Cash Equivalents | |||||||||||||||||||||||||||||
| Money Market Fund | $ | $ | $ | $ | $ | ||||||||||||||||||||||||
| Total Cash Equivalents | $ | $ | $ | $ | $ | ||||||||||||||||||||||||
| Investments | |||||||||||||||||||||||||||||
| Portfolio Companies | $ | $ | $ | $ | $ | ||||||||||||||||||||||||
| Unaffiliated Investee Funds | |||||||||||||||||||||||||||||
| Debt Investments | |||||||||||||||||||||||||||||
| Total Investments | |||||||||||||||||||||||||||||
| Affiliated Investee Funds | |||||||||||||||||||||||||||||
| Derivative Assets | |||||||||||||||||||||||||||||
| $ | $ | $ | $ | $ | |||||||||||||||||||||||||
| Liabilities | |||||||||||||||||||||||||||||
| Derivative Liabilities | $ | $ | $ | $ | $ | ||||||||||||||||||||||||
16
TPG Private Equity Opportunities, L.P.
Notes to Condensed Consolidated Financial Statements (Unaudited)
(All Dollars are in Thousands, Except Unit and Per Unit Data, Except Where Noted)
The following table summarizes the quantitative inputs and assumptions used for valuation of investments categorized in Level III of the fair value hierarchy as of September 30, 2025:
| Fair Value | Valuation Techniques | Unobservable Inputs | Ranges | Weighted-Average | Impact to Valuation from an Increase in Input | ||||||||||||||||||||||||||||||
| Financial Assets | |||||||||||||||||||||||||||||||||||
| Investments | |||||||||||||||||||||||||||||||||||
| Portfolio Companies | $ | Market Comparables | LTM EBITDA Multiple | Increase | |||||||||||||||||||||||||||||||
| FWD EBITDA Multiple | Increase | ||||||||||||||||||||||||||||||||||
| Last Transaction Price | Operating and Market Performance | ||||||||||||||||||||||||||||||||||
| SOTP | EV/EBITDA Multiple | Increase | |||||||||||||||||||||||||||||||||
| NTM EBITDA Multiple | Increase | ||||||||||||||||||||||||||||||||||
| Discounted Cash Flows | Discount Rate | Decrease | |||||||||||||||||||||||||||||||||
| Debt Investments | Market Comparables | LTM EBITDA Multiple | Increase | ||||||||||||||||||||||||||||||||
| Total Investments | $ | ||||||||||||||||||||||||||||||||||
17
TPG Private Equity Opportunities, L.P.
Notes to Condensed Consolidated Financial Statements (Unaudited)
(All Dollars are in Thousands, Except Unit and Per Unit Data, Except Where Noted)
The following tables present changes in the fair value of investments for which Level III inputs were used to determine the fair value for the three and nine months ended September 30, 2025:
| Level III Financial Assets at Fair Value | |||||||||||||||||
| Three Months Ended September 30, 2025 | |||||||||||||||||
| Portfolio Companies | Debt Investments | Total | |||||||||||||||
| Balance, Beginning of Period | $ | $ | $ | ||||||||||||||
| Purchases | |||||||||||||||||
| Sales and Proceeds from Investments | |||||||||||||||||
| Transfer Into Level III | |||||||||||||||||
| Transfer Out of Level III | |||||||||||||||||
| Change in Gain (Loss) Included in Net Assets | |||||||||||||||||
| Balance, End of Period | $ | $ | $ | ||||||||||||||
| Net Change in Unrealized Gain (Loss) on Investments Included in Condensed Consolidated Statements of Operations | $ | $ | $ | ||||||||||||||
| Level III Financial Assets at Fair Value | |||||||||||||||||
| Nine Months Ended September 30, 2025 | |||||||||||||||||
| Portfolio Companies | Debt Investments | Total | |||||||||||||||
| Balance, Beginning of Period | $ | $ | $ | ||||||||||||||
| Purchases | |||||||||||||||||
| Sales and Proceeds from Investments | |||||||||||||||||
| Transfer Into Level III | |||||||||||||||||
| Transfer Out of Level III | |||||||||||||||||
| Change in Gain (Loss) Included in Net Assets | |||||||||||||||||
| Balance, End of Period | $ | $ | $ | ||||||||||||||
| Net Change in Unrealized Gain (Loss) on Investments Included in Condensed Consolidated Statements of Operations | $ | $ | $ | ||||||||||||||
NAV as a Practical Expedient
The following table summarizes investments that estimate fair value using NAV as a practical expedient. This includes information such as investment strategy, or industry, unfunded commitments (if applicable) and the fair value of the respective investments. As of September 30, 2025, a majority of these investments may not be redeemed at or within three months of the reporting date and certain investments may not be sold without a general partner’s consent. Certain investments cannot be redeemed and distributions received will be a result of income and/or sales of underlying assets of each investment; however, an estimate of the period of time over which the underlying assets are expected to be liquidated for such investments cannot be made.
18
TPG Private Equity Opportunities, L.P.
Notes to Condensed Consolidated Financial Statements (Unaudited)
(All Dollars are in Thousands, Except Unit and Per Unit Data, Except Where Noted)
| NAV as a Practical Expedient Investments by Industry | Unfunded Commitment | Fair Value | ||||||||||||
| Financial Services | ||||||||||||||
| Growth VI | $ | $ | ||||||||||||
| GP-Led Secondaries | ||||||||||||||
| Other investment in affiliated investee fund | ||||||||||||||
| Consumer Services | ||||||||||||||
| Other investments in unaffiliated investee funds | ||||||||||||||
| Software & Services | ||||||||||||||
| Other investments in unaffiliated investee funds | ||||||||||||||
| Health Care Equipment & Services | ||||||||||||||
| Other investment in unaffiliated investee fund | ||||||||||||||
For the three and nine month periods ended September 30, 2025, total unrealized gains on investments in affiliated investee funds were $6.8 million and $13.1 million, respectively.
4. Derivative Instruments
In the normal course of business, the Fund may enter into derivative contracts to achieve certain risk management objectives.
The Fund may enter into derivative instruments to hedge against foreign currency exchange rate risk on a portion or all of its non-U.S. dollar denominated investments. These instruments primarily include foreign currency forward contracts. The Fund utilizes forward currency contracts to economically hedge the currency exposure associated with certain foreign-denominated investments. These derivative contracts are not designated as hedging instruments for accounting purposes. The use of foreign currency forward contracts does not eliminate fluctuations in the price of the underlying investments recognized by the Fund.
As a result of the use of derivative contracts, the Fund is exposed to the risk that counterparties will fail to fulfill their contractual obligations. To mitigate such counterparty risk, the Fund enters into contracts with certain major financial institutions, all of which have investment grade ratings. Counterparty credit risk is evaluated in determining the fair value of derivative instruments.
The table below summarizes the aggregate notional amount and fair value of the derivative instruments. The notional amount represents the absolute value amount of the foreign exchange contracts:
| September 30, 2025 | |||||||||||||||||||||||
| Assets | Liabilities | ||||||||||||||||||||||
| Notional | Fair Value | Notional | Fair Value | ||||||||||||||||||||
| Derivative Instruments | |||||||||||||||||||||||
| Foreign Currency Forward Contracts | $ | $ | $ | $ | ( | ||||||||||||||||||
| $ | $ | ( | |||||||||||||||||||||
19
TPG Private Equity Opportunities, L.P.
Notes to Condensed Consolidated Financial Statements (Unaudited)
(All Dollars are in Thousands, Except Unit and Per Unit Data, Except Where Noted)
The table below summarizes the impact to the Condensed Consolidated Statements of Operations from derivative instruments:
| Three Months Ended September 30, | Nine Months Ended September 30, | ||||||||||||||||||||||
| 2025 | 2024 | 2025 | 2024 | ||||||||||||||||||||
| Derivative Instruments | |||||||||||||||||||||||
| Net Change in Unrealized Gain (Loss) | |||||||||||||||||||||||
| Foreign Currency Forward Contracts | $ | ( | $ | $ | ( | $ | |||||||||||||||||
5. Line of Credit Agreement
On August 26, 2025, a subsidiary of the Fund, as well as any additional borrower entities that may be added and removed from time to time (the “Borrowers”), entered into an unsecured, uncommitted line of credit (the “Line of Credit”) up to a maximum amount of $250.0 million with TPG Operating Group II, L.P. (the “Lender”), an affiliate of the General Partner. The line of credit expires on August 26, 2026, subject to six-month extension options requiring the Lender’s approval (the “Line Availability End Date”).
Under the Line of Credit, the interest rate on the unpaid principal amount of each loan made to the Borrower is the then-current rate offered by a third-party lender or, if no such rate is available, Secured Overnight Financing Rate (“SOFR”) applicable to such loan plus 3.50 %. Each advance under the Line of Credit is repayable on the earliest of (1) the 180th day following the earlier of (A) the Lender’s demand and (B) the Line Availability End Date, and (2) the scheduled date of repayment for each loan, which date shall not be later than 364 days following the borrowing of such loan, unless the Lender otherwise consents. To the extent the Borrowers have not repaid all loans and other obligations under the line of credit after a repayment event has occurred, the Borrowers shall use commercially reasonable efforts to apply excess available cash proceeds to the repayment of such loans and other obligations; provided that the Borrowers will be permitted to (w) make payments to fulfill any repurchase requests pursuant to the Fund’s redemption program on the terms substantially consistent with those described in the Fund’s filings with the Securities and Exchange Commission, (x) use funds to close any acquisition which the Fund entered into prior to receiving a demand notice, (y) make distributions to avoid any entity level tax, and (z) pay any income taxes when due. The Line of Credit also permits voluntary prepayment of principal and accrued interest without any penalty other than customary breakage costs subject to the Lender’s reasonable determination. Each Borrower may withdraw from the Line of Credit at the time all such obligations held by such Borrower to the Lender under the Line of Credit have been repaid to the Lender in full. The Line of Credit contains customary events of default. As is customary in such financings, if an event of default occurs under the Line of Credit, the Lender may accelerate the repayment of amounts outstanding under the Line of Credit and exercise other remedies subject, in certain instances, to the expiration of an applicable cure period.
None of the Lender and its assignees shall have any recourse to any general partner of any Borrower, any investor of any Borrower, including the Fund, or any of their respective assets for any indebtedness or other monetary obligation incurred under the Line of Credit. There were no borrowings during the three-month period ended September 30, 2025 and no amounts outstanding under the Line of Credit as of September 30, 2025.
6. Net Assets
In connection with its formation, T-POP has the authority to issue an unlimited number of units of each unit class.
T-POP offers, on a monthly basis, in a continuous private placement, seven classes of limited partnership units: Class S, Class R-S, Class D, Class R-D, Class I, Class R-I and Class F units. Class S/Class R-S and Class D/Class R-D units bear a Servicing Fee in an amount equal to, on an annualized basis, 0.85 % and 0.25 %, respectively, of the Transactional NAV of each class of units as of the last day of each month. In calculating the Servicing Fee, T-POP uses the Transactional NAV before giving effect to any accruals for the Servicing Fee, repurchases, if any, for that month and distributions payable on T-POP’s units. No Servicing Fee is payable with respect to Class I, Class R-I or Class F units. The purchase price per unit of each class is equal to the Transactional NAV per unit for such class as of the last calendar day of the immediately preceding month. Before T-POP determined its first Transactional NAV, the initial subscription price for units was $25.00 per unit.
20
TPG Private Equity Opportunities, L.P.
Notes to Condensed Consolidated Financial Statements (Unaudited)
(All Dollars are in Thousands, Except Unit and Per Unit Data, Except Where Noted)
Certain financial intermediaries through which a limited partner is placed in T-POP may charge the limited partner upfront selling commissions, placement fees, subscription fees or similar fees (“Subscription Fees”) of up to (a) 3.5 % of Transactional NAV on Class S and Class R-S units and (b) 1.5 % of Transactional NAV on Class D and Class R-D units sold in the offering. These Subscription Fees are paid by the limited partner outside of its investment in T-POP and not reflected in T-POP’s Transactional NAV.
On August 30, 2024, the General Partner and TPG LP A, Inc., an affiliate of the Management Company (the “Initial Limited Partner”) agreed to contribute one dollar each as T-POP’s initial capital contribution to form the TPG Private Equity Opportunities, L.P. partnership (the “August 2024 Contribution”). On January 14, 2025 and January 28, 2025, T-POP received in cash an aggregate contribution of twenty-five dollars (inclusive of the August 2024 Contribution) from the General Partner in exchange for one Class F Unit of T-POP and nine hundred seventy-five dollars (inclusive of the August 2024 Contribution) from the Initial Limited Partner in exchange for 39 Class F Units of T-POP.
The Transactional NAV for each unit class is calculated monthly by the Management Company. The Transactional NAV is based on the month-end values of investments, the addition of the value of any other assets such as cash, and the deduction of any liabilities, including the accrual and allocation of the Management Fee, the Performance Participation Allocation and the Maintenance Fee and the deduction of expenses attributable to certain unit classes, such as applicable Servicing Fees.
The following tables present transactions in the Units during the three and nine months ended September 30, 2025:
| Class R-S Units | Class R-D Units | Class R-I Units | Class F Units (a) | |||||||||||||||||||||||
| Units Outstanding as of June 30, 2025 | ||||||||||||||||||||||||||
| Units Issued | ||||||||||||||||||||||||||
| Unit outstanding as of September 30, 2025 | ||||||||||||||||||||||||||
| Class R-S Units | Class R-D Units | Class R-I Units | Class F Units (a) | |||||||||||||||||||||||
| Units Outstanding as of December 31, 2024 | ||||||||||||||||||||||||||
| Units Issued | ||||||||||||||||||||||||||
| Units Outstanding as of September 30, 2025 | ||||||||||||||||||||||||||
_______________
(a)Class F includes 7,776 of issued units to the Board of Directors of T-POP in accordance with their Restricted Unit Award Agreement.
Redemption Program
T-POP has implemented a redemption program (the “Redemption Program”) in which it offers its limited partners the opportunity to redeem in each quarter up to 5 % of T-POP’s units outstanding (by aggregate Transactional NAV of T-POP (including Transactional NAV attributable to any feeder fund) and any Parallel Investment Entity) as of the last calendar day of the immediately preceding calendar quarter. Redemption offers are expected to commence the second full quarter following the Initial Closing. Such redemptions are subject to T-POP’s limited partnership agreement (“Partnership Agreement”).
Under the Redemption Program, to the extent T-POP offers to redeem Units in any particular quarter, T-POP redeems Units using a purchase price equal to T-POP’s Transactional NAV per Unit as of the last calendar day of the applicable quarter (the “Redemption Date”), subject to the Early Redemption Deduction (as defined below).
21
TPG Private Equity Opportunities, L.P.
Notes to Condensed Consolidated Financial Statements (Unaudited)
(All Dollars are in Thousands, Except Unit and Per Unit Data, Except Where Noted)
7. Related Party Transactions
Partnership Agreement
The Fund has entered into a limited partnership agreement as amended and restated with the General Partner. Under the terms of the T-POP’s Partnership Agreement, overall responsibility for T-POP’s oversight rests with the General Partner, subject to certain oversight rights held by the Board of Directors.
Performance Participation Allocation
The General Partner, or any other entity designated by the General Partner, is allocated a Performance Participation Allocation by T-POP equal to 12.5 % of total return subject to a 5 % annual hurdle amount and a high water mark with 100 % catch-up. Such allocation is measured on a calendar year basis, distributed or allocated annually and accrued monthly (subject to pro-rating for partial periods), and without taking into account accrued and unpaid taxes of any intermediate entity through which T-POP indirectly invests in an investment or taxes paid by any such intermediate entity during the applicable month. The General Partner may elect to receive the Performance Participation Allocation in cash, units and/or shares or units of intermediate entities. If the Performance Participation Allocation is paid in T-POP units, such units may be repurchased at the General Partner’s request and is subject to certain limitations. Limited Partners in T-POP, the Feeder and any Parallel Investment Entities indirectly bear a portion of the Performance Participation Allocation paid by the Aggregator (indirectly through the Aggregator’s consolidated subsidiaries), but such expenses are not duplicated at T-POP, the Feeder or Parallel Investment Entities. For the three and nine month period ended September 30, 2025, T-POP accrued Performance Participation Allocation of $5.6 million and $7.2 million, respectively, as presented on the Condensed Consolidated Statements of Operations.
Management Agreement
The Fund has entered into a management agreement with the Management Company (the “Management Agreement”). The Management Company shall provide portfolio management, risk management and other services to the Fund (and in the General Partner’s discretion, to any subsidiary of the Fund) during the term as the Fund and the Management Company shall reasonably agree.
Management Fee
In consideration for its investment management services, T-POP pays the Management Company a management fee (the “Management Fee”), in accordance with the Management Agreement, calculated and payable monthly in arrears, equal to, for each calendar month, commencing calendar months after the Initial Closing, in the aggregate, (i) 1.25 % of T-POP’s Transactional NAV per annum of the Class S, Class D and Class I units and (ii) 1.00 % of T-POP’s Transactional NAV per annum of the Class R-S, Class R-D and Class R-I units for a 36-month period following the th-month anniversary of the Initial Closing, and 1.25 % of T-POP’s Transactional NAV per annum of such units thereafter, in each case, before giving effect to any accruals for the Management Fee, the Servicing Fee (as defined below), the Performance Participation Allocation, the Maintenance Fee (as defined below), any repurchases (and pending repurchases), any distributions and without taking into account any accrued and unpaid taxes of any intermediate entity through which T-POP indirectly invests in an investment or taxes paid by any such intermediate entity during the applicable month.
The Management Company may elect to receive the Management Fee in cash, units of T-POP or any Parallel Investment Entities, and/or shares or units of intermediate entities. If the Management Fee is paid in T-POP units, such units may be repurchased at the Management Company’s request and will be subject to certain limitations.
Maintenance Fee
In consideration for its operational services, the Management Company is entitled to receive a maintenance fee (the “Maintenance Fee”) from T-POP (directly or indirectly through an intermediate entity) payable in cash monthly in arrears equal to, in the aggregate, 0.10 % of T-POP’s Transactional NAV per annum, before giving effect to any accruals for the Management Fee, the Servicing Fee, the Performance Participation Allocation, the Maintenance Fee, any repurchases (and pending repurchases), any distributions and without taking into account accrued and unpaid taxes of any intermediate entity
22
TPG Private Equity Opportunities, L.P.
Notes to Condensed Consolidated Financial Statements (Unaudited)
(All Dollars are in Thousands, Except Unit and Per Unit Data, Except Where Noted)
through which T-POP indirectly invests in an investment or taxes paid by any such intermediate entity during the applicable month.
Dealer Manager Agreement
T-POP entered into a Dealer Manager Agreement with TPG Capital BD, LLC, a broker-dealer registered with the SEC under the Securities Exchange Act of 1934, as amended, and a member of the Financial Industry Regulatory Authority. Pursuant to the Dealer Manager Agreement, the Dealer Manager manages T-POP’s relationships with third-party brokers engaged by the Dealer Manager to participate in the distribution of units, which are referred to as participating brokers, and financial advisors. The Dealer Manager also coordinates T-POP’s marketing and distribution efforts with participating brokers and their registered representatives with respect to communications related to the terms of T-POP’s offering, its investment strategies, material aspects of its operations and subscription procedures.
The Dealer Manager is entitled to receive Servicing Fees monthly in arrears at an annual rate of 0.85 % of the value of T-POP’s Transactional NAV attributable to Class S and Class R-S units as of the last day of each month. The Dealer Manager is entitled to receive the Servicing Fees monthly in arrears at an annual rate of 0.25 % of the value of T-POP’s Transactional NAV attributable to Class D and Class R-D units as of the last day of each month. There are no Servicing Fees with respect to Class I, Class R-I and Class F units. The Servicing Fees are payable to the Dealer Manager, but the Dealer Manager anticipates that all or a portion of such fees will be retained by, or reallocated (paid) to, participating brokers or other financial intermediaries. See Note 5. “Net Assets” for further details.
T-POP accrues the cost of the servicing fees, as applicable, for the estimated life of the Units as an offering cost at the time Class R-S and Class R-D Units are sold. Accrued servicing fees as of September 30, 2025 were $6.6 million for Class R-S Units and $0.04 million for Class R-D Units.
Feeder
TPG Private Equity Opportunities Fund (TE) L.P. (the “Feeder”) is a feeder vehicle for T-POP. The Feeder was established to allow certain investors with particular tax characteristics, such as tax-exempt investors and non-U.S. investors, to participate in T-POP in a more efficient manner. The Feeder is obligated to bear (without duplication) its proportional share of the Management Fee based on its proportional interest in the aggregator entity in which T-POP invests. Investors in the Feeder indirectly bear a portion of the Performance Participation Allocation payable by T-POP, but such expenses are not duplicated at the Feeder level.
Affiliates
The General Partner, Management Company, Dealer Manager, Feeder TE, and Parallel Investment Entities, the Aggregator, and other vehicles sponsored, advised and/or managed by TPG or its affiliates are affiliates of T-POP.
Investment Transfer Agreement
Pursuant to the Transfer Agreement (the “Transfer Agreement”), dated as of June 18, 2025 between various affiliated entities of the General Partner (the “Transferors”), T-POP and the Management Company, T-POP purchased investments that have been warehoused by the Transferors in connection with T-POP’s formation (the “Warehoused Investments”). T-POP acquired $134.1 million of Warehoused Investments in June 2025, with an additional $114.5 million purchased during the three-month period ended September 30, 2025, which brings total purchases as of September 30, 2025 to $248.6 million. Such Warehoused Investments were purchased at historical cost with any unfunded portion of a Warehoused Investment transferred to T-POP at no additional cost. The transactions were approved by T-POP’s independent directors. Pursuant to the Transfer Agreement, additional purchases of the Warehoused Investments by T-POP may be made from time to time on the same terms and conditions described above. As of September 30, 2025, $146.9 million of Warehoused Investments remain that may be acquired.
Line of Credit Agreement
The Borrowers entered into the Line of Credit with the Lender. For additional information, see Note 5 “Line of Credit Agreement.”
23
TPG Private Equity Opportunities, L.P.
Notes to Condensed Consolidated Financial Statements (Unaudited)
(All Dollars are in Thousands, Except Unit and Per Unit Data, Except Where Noted)
8. Commitments and Contingencies
The Management Company has agreed to advance organizational and offering expenses, other than subscription fees and Servicing Fees related to Class S, Class R-S, Class D and Class R-D units, on T-POP’s behalf through the first anniversary of T-POP’s Initial Closing. T-POP will reimburse the Management Company for all such advanced expenses ratably over the 60 months following the anniversary of the Initial Closing. As of September 30, 2025, the Management Company and its affiliates have incurred organizational and offering expenses on T-POP’s behalf in the amount of $8.1 million.
The Fund had unfunded commitments of $20.3 million in portfolio companies, $54.8 million in unaffiliated investee funds and $145.3 million in affiliated investee funds as of September 30, 2025.
T-POP may, from time to time, be party to various legal matters arising in the ordinary course of business, including claims and litigation proceedings. As of September 30, 2025, T-POP was not subject to any material litigation nor was T-POP aware of any material litigation threatened against it.
9. Income Taxes
T-POP is treated as a partnership for income tax purposes and is not subject to income tax. As a pass-through entity, each partner or member therein is responsible for income taxes related to income or loss based on their respective share of an entity’s income and expenses. In addition, T-POP intends to operate, in part, through subsidiaries that may be treated as corporations for U.S. and non-U.S. tax purposes and therefore may be subject to U.S. federal, state and/or local income taxes at the subsidiary level. As of September 30, 2025, T-POP has recognized net deferred tax liabilities of $1.1 million in connection with these subsidiaries.
For the three and nine months ended September 30, 2025, the effective tax rate was 1.45 % and 2.27 % respectively. The Fund’s overall effective tax rate in each of the periods described above deviates from the statutory rate of 0 % primarily because U.S. federal, state and local taxes on income from certain subsidiaries that are treated as corporations for U.S. federal, state or local purposes.
As of September 30, 2025, T-POP has not identified any uncertain tax positions that require recognition or disclosure. The Fund files its tax returns as prescribed by the tax laws of the jurisdictions in which it operates. In the normal course of business, the Fund is subject to examination by U.S. federal, state, local and foreign tax authorities. Although the outcome of tax audits is always uncertain, the Fund does not believe the outcome of any future audit will have a material adverse effect on the Fund’s Condensed Consolidated Financial Statements.
On July 4, 2025, the One Big Beautiful Bill Act (“OBBBA”) was enacted in the United States. The OBBBA, among other provisions, includes an extension of certain expiring elements of the Tax Cuts and Jobs Act. The legislation has multiple effective dates, with certain provisions effective in 2025 and others implemented through 2027. At this time, the Fund does not expect the OBBBA to have a material impact on its financial statements. The Fund will continue to evaluate its future impact as regulations are issued by the U.S. Department of the Treasury.
24
TPG Private Equity Opportunities, L.P.
Notes to Condensed Consolidated Financial Statements (Unaudited)
(All Dollars are in Thousands, Except Unit and Per Unit Data, Except Where Noted)
10. Financial Highlights
The following are the financial highlights of the Fund attributed to each Class of Units:
| Nine Months Ended September 30, 2025 | ||||||||||||||||||||||||||
| Class R-S Units | Class R-D Units | Class R-I Units | Class F Units | |||||||||||||||||||||||
| Per Unit Data | ||||||||||||||||||||||||||
| Net Asset Value, Beginning of Period | $ | $ | $ | $ | ||||||||||||||||||||||
| Proceeds from Units Issued | ||||||||||||||||||||||||||
| Net Investment Income (Loss) | ( | ( | ( | ( | ||||||||||||||||||||||
| Provision for Income Taxes | ( | ( | ( | ( | ||||||||||||||||||||||
| Net Change in Unrealized Gain (Loss) on Investments and Derivative Contracts | ||||||||||||||||||||||||||
| Servicing Fees | ( | ( | ||||||||||||||||||||||||
| Net Asset Value, End of Period | $ | $ | $ | $ | ||||||||||||||||||||||
| Units Outstanding, End of Period | ||||||||||||||||||||||||||
Total Return Based on Net Asset Value(a) | % | % | % | % | ||||||||||||||||||||||
| Ratios to Weighted-Average Net Assets (Non-Annualized) | ||||||||||||||||||||||||||
| Accrued Performance Participation Allocation | ( | % | ( | % | ( | % | % | |||||||||||||||||||
| Total Expenses without Accrued Performance Participation Allocation | ( | % | ( | % | ( | % | ( | % | ||||||||||||||||||
Total Expenses(b) | ( | % | ( | % | ( | % | ( | % | ||||||||||||||||||
| Net Investment Loss | ( | % | ( | % | ( | % | ( | % | ||||||||||||||||||
_______________
(a)Total return is calculated as the change in Net Asset Value per Unit during the period, plus distributions per Unit (assuming dividends and distributions are reinvested in accordance with T-POP’s distribution reinvestment plan) divided by the initial Net Asset Value per Unit of $25.00 . Total return does not include upfront transaction fees, if any.
(b)Expense ratio includes Organizational Expenses, Accrued Performance Participation Allocation, Maintenance Fees, and Other.
11. Subsequent Events
On October 1, 2025, the Fund sold unregistered limited partnership units of the Fund as part of its continuous private offering for aggregate consideration of $83.9 million. The following table details the Units sold:
| Class | Number of Units Sold | Aggregate Consideration | ||||||||||||
| Class R-I | $ | |||||||||||||
| Class R-S | $ | |||||||||||||
On October 1, 2025, the T-POP Fund Complex (inclusive of the Fund) issued interests for aggregate consideration of approximately $248.2 million.
On October 1, 2025, the Aggregator received additional capital contributions from the Parallel Investment Entities. As a result, the Fund determined that it no longer holds a controlling financial interest in the Aggregator. Accordingly, the Fund will deconsolidate the Aggregator and measure its investment in the Aggregator at fair value, using the Aggregator’s reported NAV as a practical expedient. The deconsolidation is not expected to have a material impact on the Fund’s financial position, ongoing operations, or cash flows.
On October 30, 2025, in accordance with the Transfer Agreement, the Aggregator acquired additional Warehoused Investments for a purchase price of $77.2 million.
25
TPG Private Equity Opportunities, L.P.
Notes to Condensed Consolidated Financial Statements (Unaudited)
(All Dollars are in Thousands, Except Unit and Per Unit Data, Except Where Noted)
The Fund’s management evaluated subsequent events through the date of issuance of these financial statements. There have been no additional subsequent events that occurred that would require disclosure in, or would be required to be recognized in, these financial statements.
26
Item 2. Management’s Discussion and Analysis of Financial Condition and Results of Operations.
In this Quarterly Report on Form 10-Q, or this "report," we refer to TPG Private Equity Opportunities, L.P. and its consolidated subsidiaries as "we," "us," the "Fund," "T-POP," or "our," unless we specifically state otherwise or the context indicates otherwise. We refer to our investment adviser, T-POP Management Company, LLC, as the “Management Company” and we refer to the direct parent company of the Management Company, TPG Solutions Advisors, LLC., as "Solutions Advisors."
Overview
TPG Private Equity Opportunities, L.P. (“T-POP”) is a Delaware limited partnership formed on August 30, 2024 as a private fund exempt from registration under Section 3(c)(7) of the Investment Company Act of 1940, as amended (the “1940 Act”). T-POP is an investment fund established by TPG Inc. (“TPG”) with an investment objective to generate investment returns by providing its Limited Partners with broad exposure to investments across the private equity strategies of TPG. Structured as a perpetual-life vehicle, the Fund accepts fully funded subscriptions monthly and aims to provide investors with a liquidity option by means of a quarterly redemption program.
T-POP was established by TPG to provide eligible investors with access to TPG’s private equity franchise through a single investment. T-POP seeks to construct an attractive and diversified portfolio of private equity assets primarily by making direct co-investments in transactions executed by TPG’s private equity strategies and, to a lesser extent, primary fund commitments to such strategies. TPG’s private equity strategies that T-POP may invest in currently include TPG Capital, TPG Healthcare Partners, TPG Asia, TPG Emerging Companies Asia, TPG Growth, TPG Tech Adjacencies, TPG Life Sciences Innovations, The Rise Funds, TPG Rise Climate, TPG GP Solutions, and TPG NewQuest. Percentage allocations across the private equity strategies will vary over time, and the Management Company may determine not to invest in one or more of such strategies in its sole discretion.
By leveraging the investment capabilities of TPG, T-POP aims to provide investors a pure play private equity alternative that benefits from TPG’s business building capabilities and strategic orientation towards attractive, growing sectors, and thereby serve as a core private equity allocation within its investors’ portfolios.
We invest primarily in privately negotiated, equity-oriented investments (“Private Equity Investments”), leveraging the talent and investment capabilities of TPG’s private equity platform (the “PE Platform”) to create an attractive portfolio of alternative investments diversified across geographies and sectors. Our General Partner and our Management Company are affiliates of TPG and are collectively referred to as the “Sponsor.”
Our investment strategy includes investments in (i) Buyout transactions, which are large-scale investments, where TPG typically takes a control position in private companies, including carve-outs of business units from large corporations; (ii) Growth transactions where we acquire control or significant minority investments in growth-oriented private middle-market companies; and (iii) General Partner (GP)-led secondaries where we primarily invest in single asset continuation vehicles, alongside GPs using these investments as a means of holding what we believe to be their best assets for longer, with the GP typically rolling a substantial majority of its economics. T-POP may also pursue primary commitments to, and/or secondary market purchases of existing investments in, certain investment funds managed by TPG and third-party managers, as well as other investments that the General Partner determines are suitable for T-POP in its sole discretion. Over time, TPG expects that T-POP’s investment portfolio will include a broad pool of private equity assets that will be diversified across sector, geography, industry, market capitalization, and transaction type. T-POP will also generally seek to invest up to 20% of its net asset value in debt and other securities, including but not limited to, debt instruments, cash and money market funds, which may be used to provide a potential source of liquidity, generate current income and facilitate capital deployment (collectively, “Debt and Other Securities”, and together with Private Equity Investments, “Investments”). Proceeds generated by the realization of Investments are intended primarily to be redeployed into additional transactions, which is expected to drive significant compounding of asset value over time.
27
Recent Developments
Line of Credit
On August 26, 2025, a subsidiary of the Fund, entered into an unsecured, uncommitted Line of Credit to provide for up to a maximum aggregate principal amount of $250.0 million with TPG Operating Group II, L.P., an affiliate of the Company. See “Note 5 - Line of Credit” within the “Notes to Condensed Consolidated Financial Statements” for additional information.
Investment Portfolio Composition
For the three months ended September 30, 2025, T-POP closed in the following new portfolio companies and investee funds:
| Company | Description | |||||||
| Hospitality Solutions | Hotel reservation booking and management software | |||||||
| OpenAI | Provider of AI large language models with consumer and enterprise use cases | |||||||
| Anthropic | Provider of AI large language models with consumer and enterprise use cases | |||||||
| Novotech | Clinical research organization and scientific advisory company | |||||||
| xAI | Developer of advanced artificial intelligence technology and systems | |||||||
| Anovo | Fully integrated specialty pharmacy for orphan drugs | |||||||
| Aurora Energy Research | Provider of data and analytics for the global power market | |||||||
LogicMonitor(a) | IT infrastructure monitoring solutions serving enterprise customers and managed service providers | |||||||
| DirecTV | Provider of satellite and streaming video television services | |||||||
_______________
(a)Investments in unaffiliated investee funds are presented on a look-through basis to the underlying portfolio company.
During the same period, T-POP acquired $114.5 million of additional Warehoused Investments.
28
The charts below present the diversification of T-POP’s portfolio companies by strategy, sector and geography based on the fair value of our Private Equity Investments as of September 30, 2025. T-POP’s investments into funds managed by TPG are presented on a look-through basis to underlying portfolio companies.
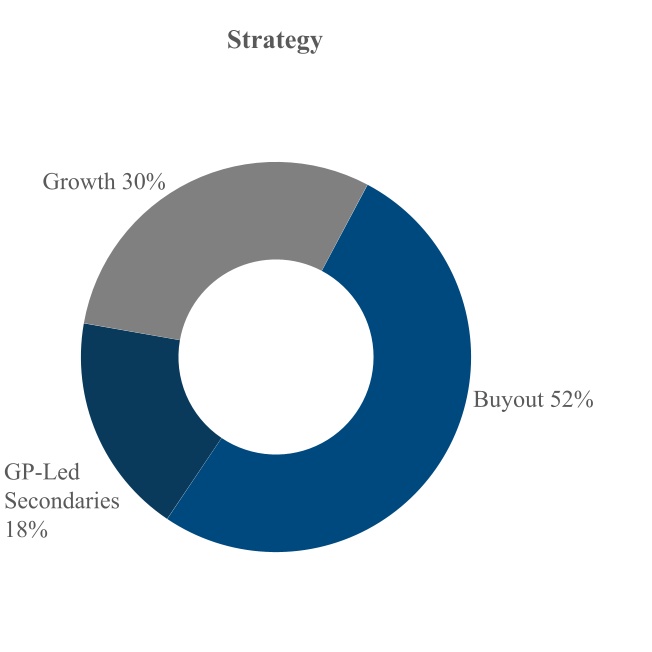
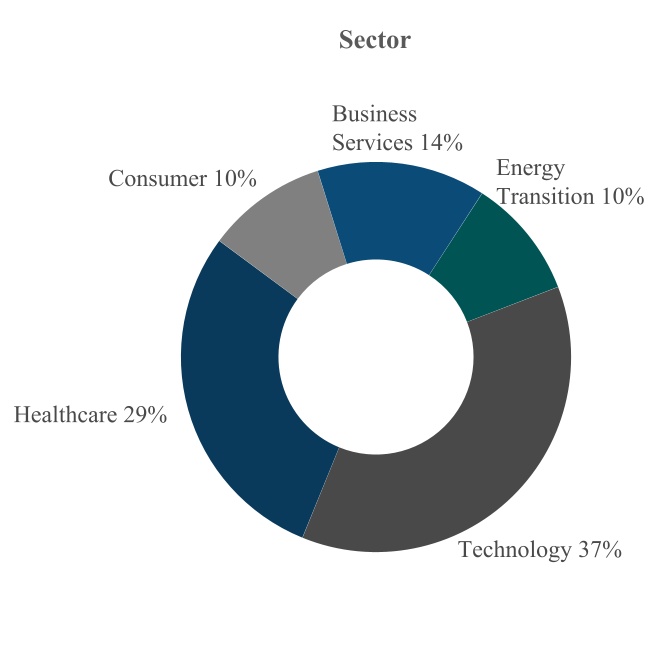
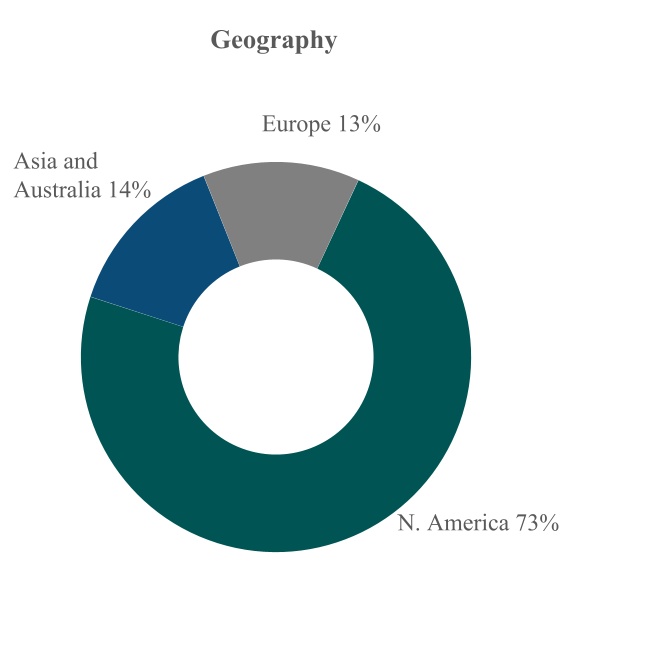
_______________
•% of fair value may not add due to rounding.
•% of fair value represents T-POP’s sum of Investments at Fair Value and Affiliated Investee Funds.
•Geography is generally based on the region where each investment is headquartered.
29
As of September 30, 2025, T-POP’s top 10 Private Equity Investments, based on fair value, were:
| Company | Strategy | Geography | Sector | |||||||||||||||||
| Surescripts | Buyout | N. America | Healthcare | |||||||||||||||||
| Hospitality Solutions | Buyout | N. America | Technology | |||||||||||||||||
| Novotech | Buyout | Asia & Australia | Healthcare | |||||||||||||||||
| Creative Planning | Buyout | N. America | Business Services | |||||||||||||||||
| DirecTV | Buyout | N. America | Technology | |||||||||||||||||
| Aurora Energy Research | Buyout | Europe | Energy Transition | |||||||||||||||||
| Intersect Power | Growth | N. America | Energy Transition | |||||||||||||||||
| Earnix | GP-Led Secondaries | N. America | Technology | |||||||||||||||||
| Aareon | Buyout | Europe | Technology | |||||||||||||||||
| Heritage Golf | GP-Led Secondaries | N. America | Consumer | |||||||||||||||||
_______________
•Investments in unaffiliated and affiliated investee funds are presented on a look-through basis to the underlying portfolio company.
Performance Summary
The total returns by each class of Investor Units are as follows:
| September 30, 2025 | ||||||||
| Unit Class | Inception To Date Total Return | |||||||
Class R-I Units | 12.13 | % | ||||||
Class R-S Units | 11.81 | % | ||||||
Class R-D Units | 6.45 | % | ||||||
•Inception to date return is from June 02, 2025 for Class R-I and Class R-S. The inception to date return for Class R-D is from July 01, 2025.
•Returns shown reflect the percent change in the Transactional NAV per unit from the beginning of the applicable period, plus the amount of any distribution per unit declared in the period. Returns shown are reflective of each unit class and not of an individual investor. The Fund believes total return is a useful measure of overall investment performance of our Units.
Business Environment
T-POP is generally reliant on TPG to source and execute private equity transactions. TPG’s business and private equity assets in general are impacted by changes in global economic conditions and regulatory or other governmental policies or actions which can materially affect the values of funds managed by TPG, as well as our ability to source attractive investments and deploy the capital that we have raised. However, we believe our disciplined investment philosophy across our diversified investment platforms and our shared investment themes focusing on attractive and resilient sectors of the global economy has historically contributed to the stability of our performance throughout market cycles.
In the third quarter, major asset classes maintained the momentum from the second quarter, with global equities, bonds, and treasuries all showing strength. Equities benefited from strong corporate earnings and resilient market sentiment, while bonds and treasuries were supported by favorable conditions stemming from monetary easing. In the United States, economic indicators painted a mixed picture: inflation remained just above the Federal Reserve’s 2.0% target, suggesting ongoing but controlled price pressures, and employment data revealed signs of weakness, including slower job growth and rising concerns about unemployment. Overall, the quarter was marked by solid returns across markets, but persistent inflation and employment challenges signaled some underlying uncertainty in the US economy.
30
Equities delivered a strong performance in the third quarter, fueled by robust corporate earnings and powerful thematic trends like artificial intelligence and data center spend. The S&P 500, Dow Jones Industrial Average, and Nasdaq Composite posted gains of 7.8%, 5.2% and 11.2%, respectively. Technology led sector returns with an 11.5% increase, followed by consumer discretionary at 10.5% and communications at 9.4%. In contrast, consumer staples declined by 2.5%, while real estate and materials saw only modest gains of 2.5% and 2.6%, respectively. Global equity markets were also positive, as the MSCI Europe, MSCI Asia Pacific, and MSCI World indices rose by 3.2%, 8.5% and 7.0%, respectively. Market volatility remained subdued, with the VIX Index ending the quarter at 16.28.
Economic indicators in the third quarter showed a mixed picture. Inflation remained stable, with the Consumer Price Index at 2.7% in July and 2.9% in August. Core inflation, which excludes volatile items such as food and energy, was 3.1% for both months. Employment data revealed signs of weakness, with only 73,000 jobs added in July and 22,000 in August. There were also large downward revisions to June payrolls, resulting in a negative payroll number for the month, marking the first time this has happened since December 2020.
The Federal Reserve reduced interest rates by 25 basis points at its September meeting, setting the new target range at 4.00% to 4.25%. This was the first rate cut since the December 2024 meeting. The Board of Governors of the Federal Reserve System (the “Fed”) has adopted a more dovish tone, suggesting that additional rate cuts could occur at the remaining meetings this year, influenced by stable inflation and signs of weakness in the job market.
The US treasury yield curve steepened in the third quarter, largely due to a rally at the front end of the curve. Following the rate cut, yields across treasuries declined quarter over quarter. Yields on one to five-year treasuries fell by about 10 basis points, while the longer maturities declined by roughly five basis points. Treasury yields continue to move lower from the relative highs seen in recent years.
Key Financial Measures
Our key financial and operating measures are discussed below:
Revenues
T-POP generates income primarily from investments in portfolio companies, affiliated or unaffiliated funds, and debt and other securities, which may consist of dividend income and interest income.
Dividend Income. Dividend income may consist primarily of (i) dividend income from portfolio companies and (ii) dividend income from investments in money market funds. Dividend income from our portfolio companies is recorded on the ex-dividend date, or, in the absence of a formal declaration of a record date, on the date when cash is received from the relevant portfolio company, but excludes any portion of distributions that are treated as a return of capital. Each distribution received from a portfolio company is evaluated to determine if the distribution should be recorded as dividend income or a return of capital. Distributions that are classified as a return of capital are recorded as a reduction in the cost basis of the investment. Dividend income from money market funds with financial institutions is recorded on an accrual basis to the extent that the Fund expects to collect such amounts. For the three and nine months ended September 30, 2025, dividend income consists of income from money market funds.
Interest Income. Interest Income consists primarily of income from debt and other securities. T-POP invests in debt and other securities to generate income and facilitate capital deployment.
Expenses
Organizational and Offering Expenses. Organizational and offering expenses are costs incurred in connection with the formation of the Fund and the offering of limited partnership units to potential investors. Prior to the anniversary of the Initial Closing, organization and offering expenses are paid by the Management Company. After T-POP accepted third party investors and commenced investment operations, costs associated with the organization of T-POP were expensed. Costs associated with the offering of Class S, Class R-S, Class D, Class R-D, Class I, Class R-I and Class F units of T-POP
31
are capitalized as deferred expense and included as an asset on the Statements of Assets and Liabilities and amortized over a twelve-month period from June 2, 2025.
Performance Participation Allocation. Performance participation allocation represents the portion of expense recognized in the period relating to amounts that the General Partner is entitled to receive, contingent upon the achievement of specified performance metrics as further defined in the accompanying Notes to the Condensed Consolidated Financial Statements.
Maintenance Fee. Maintenance fee pertains to the expense recognized in consideration of the Management Company’s operational services rendered for T-POP as further defined in the accompanying Notes to the Condensed Consolidated Financial Statements.
Other Expenses. Other expenses include costs primarily related to fund administration and professional services including legal and audit fees.
Realized Gain (Loss) and Net Change in Unrealized Gain (Loss) on Investments and Derivative Contracts
Realized gains or losses are measured as the difference between the net proceeds from the sale, repayment, or disposal of an asset and the adjusted cost basis of the asset, without regard to unrealized gains or losses previously recognized. Net change in unrealized gains or losses reflects the change in investment values during the reporting period, including any reversal of previously recorded unrealized gains or losses, when gains or losses are realized.
Results of Operations
From inception through June 02, 2025, we had not commenced our principal operations and were focused on our formation and preparation for fundraising and the commencement of investment operations. We commenced principal operations on June 02, 2025.
Three Months Ended September 30, 2025
The results of operations for the three month period ended September 30, 2025 are discussed below:
For the three month period ended September 30, 2025, T-POP’s net increase in net assets resulting from operations of $35.6 million was attributable to $46.5 million in net unrealized gain on investments and derivative contracts, partially offset by $10.4 million in net investment loss.
Revenues
For the three month period ended September 30, 2025, T-POP recognized dividend income of $1.9 million from investments in money market funds.
Expenses
For the three month period ended September 30, 2025, T-POP incurred $12.3 million in total expenses which consisted of organization expenses of $0.4 million associated with the commencement of operations, performance participation allocation of $5.6 million, professional fees of $5.1 million, and other expenses of $0.8 million which is primarily related to audit and administration fees.
Net Investment Income (Loss)
For the three month period ended September 30, 2025, T-POP’s net investment loss was $10.4 million which was attributable to $12.3 million of expenses partially offset by $1.9 million of dividend income from money market funds.
32
Provision for Income Taxes
For the three month period ended September 30, 2025, T-POP recognized $0.5 million in net deferred tax expense in connection with subsidiaries that may be treated as corporations for U.S. and non-U.S. tax purposes and therefore may be subject to U.S. federal, state and/or local income taxes.
Unrealized Gain (Loss) on Investments and Derivative Contracts
For the three month period ended September 30, 2025, T-POP recognized $46.5 million of unrealized gain on investments and derivative contracts mainly driven by a $46.6 million appreciation in the fair value of investments and investments in affiliated investee funds. The unrealized gain on investments and investments in affiliate funds was offset by $0.1 million of unrealized loss on derivative contracts.
Nine Months Ended September 30, 2025
The results of operations for the nine month period ended September 30, 2025 are discussed below:
For the nine month period ended September 30, 2025, T-POP’s net increase in net assets resulting from operations of $46.4 million was mainly attributable to $66.3 million in net unrealized gain on investments and derivative contracts, partially offset by $18.8 million in net investment loss.
Revenues
For the nine month period ended September 30, 2025, T-POP recognized dividend income of $2.5 million from investments in money market funds.
Expenses
For the nine month period ended September 30, 2025, T-POP incurred $21.4 million in total expenses which consisted of organization expenses of $7.0 million associated with the commencement of operations, performance participation allocation of $7.2 million, professional fees of $5.5 million, and other expenses of $1.1 million which primarily related to audit and administration fees.
Net Investment Income (Loss)
For the nine month period ended September 30, 2025, T-POP’s net investment loss was $18.8 million which was attributable to $21.4 million of expenses partially offset by $2.5 million of dividend income from money market funds.
Provision for Income Taxes
For the nine month period ended September 30, 2025, T-POP recognized $1.1 million in net deferred tax expense in connection with subsidiaries that may be treated as corporations for U.S. and non-U.S. tax purposes and therefore may be subject to U.S. federal, state and/or local income taxes.
Unrealized Gain (Loss) on Investments and Derivative Contracts
For the nine month period ended September 30, 2025, T-POP recognized $66.3 million of unrealized gain on investments and derivative contracts mainly driven by a $67.1 million appreciation in the fair value of investments and investments in affiliated investee funds. The unrealized gain on investments and investments in affiliated funds was offset by $0.8 million of unrealized loss on derivative contracts.
33
Financial Condition, Liquidity and Capital Resources
Since June 2, 2025, T-POP accepted $619.6 million of total subscriptions from its monthly closes in its continuous private offerings. Subsequently, T-POP purchased investments in portfolio companies and unaffiliated investee funds for $469.3 million and investments in affiliated investee funds for $57.2 million with the remainder of the subscriptions received placed in money market funds. As of September 30, 2025, T-POP had total assets of $710.6 million, which primarily consisted of $593.7 million of total investments and investments in affiliated investee funds at fair value and $115.4 million of cash and cash equivalents.
As of September 30, 2025, T-POP had total liabilities of $51.6 million. Total liabilities primarily consist of a payable for investments purchased of $20.3 million, organizational and offering costs payable of $8.1 million, servicing fees payable of $6.7 million, accrued performance participation allocation of $7.2 million, and deferred tax liability of $1.1 million.
Furthermore, T-POP holds foreign currency forward contracts with counterparties to hedge against portfolio positions with each instrument’s primary risk exposure being exchange rates against the U.S. dollar. As of September 30, 2025, T-POP recognized $0.8 million in Net Unrealized Depreciation on Foreign Currency Forward Contracts.
Net Cash Flows
The Fund generates cash primarily from (i) the net proceeds of its continuous private offering, (ii) cash flows from its operations, (iii) any financing arrangements the Fund may enter into in the future and (iv) any future offerings of its equity or debt securities.
The Fund’s primary uses of cash are for (i) Investments, (ii) the cost of operations (including the Management Fee, Maintenance Fee and Performance Participation Allocation), (iii) debt service of any borrowings, (iv) periodic repurchases, including under the Redemption Program (as described herein), and (v) cash distributions (if any) to the holders of its Units to the extent declared by the General Partner.
As of September 30, 2025, T-POP had $115.4 million in cash equivalents. For the nine month period ended September 30, 2025, the net cash used in operating activities was $403.7 million, primarily related to the purchase of $406.9 million in investments, and the net cash provided by financing activities was $519.1 million which related to proceeds from issuance of units.
Leverage
As of September 30, 2025, debt financing available to the Fund consisted of the Line of Credit (as defined in Note 5. “Line of Credit Agreement” in the “Notes to the Condensed Consolidated Financial Statements”). No amounts were outstanding under the Line of Credit as of September 30, 2025.
The Fund may utilize leverage, incur indebtedness and provide other credit support for any purpose, including to fund all or a portion of the capital necessary for an Investment.
The Fund generally does not intend to incur indebtedness for borrowed money that would cause the Leverage Ratio (as defined below) to be in excess of 30% (the “Leverage Guideline”). Any indebtedness incurred at the investment level will be excluded in the calculation of the Leverage Guideline.
“Leverage Ratio” means, on any date of incurrence of any indebtedness for borrowed money, the quotient obtained by dividing (i) Aggregate Net Leverage (as defined below) by (ii) the aggregate month-end values of the Fund’s Investments, plus the value of any other assets (such as cash on hand), as determined in accordance with the Fund’s Valuation Policy (as defined below).
“Aggregate Net Leverage” means (i) the aggregate amount of recourse indebtedness for borrowed money (e.g., bank debt) of the Fund minus (ii) cash and cash equivalents of the Fund minus, without duplication, (iii) cash used in connection with funding a deposit in advance of the closing of an investment and working capital advances.
34
For purposes of determining Aggregate Net Leverage, the General Partner shall use the principal amount of borrowings, and not the valuations of the Fund’s borrowings, and may, in its sole discretion, determine which securities and other instruments are deemed to be cash equivalents. The Fund’s assets or any part thereof, including any accounts of the Fund, may be pledged in connection with any credit facilities or indebtedness. For the avoidance of doubt, the Leverage Guideline does not apply to guarantees of indebtedness, ‘bad boy’ guarantees, preferred financing arrangements, margin loans or other related liabilities that are not recourse indebtedness for borrowed money and accordingly, our leverage may exceed the Leverage Guideline if these transactions were included.
Transactional Net Asset Value (“Transactional NAV”)
The Fund calculates the transactional net asset value (“Transactional NAV”) for purposes of establishing the price at which transactions in the respective Units are made. A description of the Fund’s valuation process was included under “Calculation of Net Asset Value” within Item 9. Market Price of and Dividends on the Registrant’s Common Equity and Related Limited Partner Matters of the Fund’s Amendment No. 1 to the Registration Statement on Form 10, filed with the Securities and Exchange Commission on February 19, 2025. Transactional NAV is based on the month-end values of the Fund’s investments and other assets and the deduction of any respective liabilities, including certain fees and expenses, in all cases as determined in accordance with the valuation policy that has been approved by the Fund’s board of directors. Organizational and offering expenses advanced on the Fund’s behalf by its investment manager are recognized as a reduction to Transactional NAV ratably over 60 months beginning in June 2026, and servicing fees, as applicable, are recognized as a reduction to Transactional NAV on a monthly basis as such fees are accrued. Certain contingent tax liabilities may not be recognized as a reduction to Transactional NAV if the Fund’s general partner reasonably expects such liabilities will not be recognized upon divestment of the underlying investment. Transactional NAV per Unit may differ from the Fund’s net asset value as determined in accordance with accounting principles generally accepted in the United States of America.
The following table provides a breakdown of the major components of the Fund’s Transactional Net Asset Value as of September 30, 2025 ($ in thousands):
| Components of T-POP’s Transactional Net Asset Value | Consolidated Net Asset Value | Less: Non-Controlling Interests(b) | Registrant | |||||||||||||||||
Investments at Fair Value (Cost $469,330) | $ | 523,291 | $ | (2,054) | $ | 521,237 | ||||||||||||||
Investments in Affiliated Investee Funds at Fair Value (Cost $57,239) | 70,360 | (276) | 70,084 | |||||||||||||||||
| Cash and Cash Equivalents | 115,393 | (453) | 114,940 | |||||||||||||||||
| Other Assets | 887 | (3) | 884 | |||||||||||||||||
| Accrued Performance Participation Allocation | (7,200) | 23 | (7,177) | |||||||||||||||||
| Deferred Tax Liabilities | (1,076) | 4 | (1,072) | |||||||||||||||||
| Other Liabilities | (28,573) | 112 | (28,461) | |||||||||||||||||
Servicing Fees Payable (a) | (166) | — | (166) | |||||||||||||||||
| Transactional Net Asset Value | $ | 672,916 | $ | (2,647) | $ | 670,269 | ||||||||||||||
_______________
(a)Servicing Fees Payable only apply to Class R-S and Class R-D Units. For purposes of T-POP’s Transactional NAV, the fees are recognized as a reduction of T-POP’s Transactional NAV on a monthly basis. For purposes of calculating net asset value in accordance with GAAP, the Fund accrues the cost of the servicing fees, as applicable, for the estimated life of the units as an offering cost at the time the Fund sells Class R-S and Class R-D Units.
(b)Non-Controlling Interests relate to the Parallel Investment Entities’ interest in the Aggregator.
35
The following table provides a breakdown of the Fund’s Transactional Net Asset Value per Unit by class as of September 30, 2025:
| September 30, 2025 | ||||||||||||||||||||
| Class | Transactional NAV per Unit | Number of Units | Transactional NAV ($ in thousands) | |||||||||||||||||
Class R-I (a) | $ | 28.03 | 14,464,734 | $ | 405,494 | |||||||||||||||
| Class R-S | $ | 27.95 | 8,315,857 | 232,447 | ||||||||||||||||
| Class R-D | $ | 28.01 | 170,356 | 4,772 | ||||||||||||||||
| Class F | $ | 28.47 | 967,776 | 27,556 | ||||||||||||||||
| Total | 23,918,723 | $ | 670,269 | |||||||||||||||||
_______________
(a)Transactional NAV per Unit for Class R-I does not reflect Feeder TE specific expenses and other net assets and liabilities. In addition, it does not reflect Class F_TE units which are not subject to management fees or performance participation allocations.
The following table reconciles GAAP Net Asset Value to the Registrant’s Transactional Net Asset Value:
| September 30, 2025 | ||||||||
| GAAP Net Asset Value | $ | 659,033 | ||||||
| Adjustments | ||||||||
Organization and Offering Expenses (a) | 7,378 | |||||||
Servicing Fees (b) | 6,505 | |||||||
Non-Controlling Interests (c) | (2,647) | |||||||
| Transactional Net Asset Value | $ | 670,269 | ||||||
_______________
(a)Represents an adjustment for the recognition of organizational and offering expenses ratably over the 60‐month reimbursement period beginning June 1, 2026 including the Parallel Investment Entities’ portion.
(b)Represents an adjustment to reflect servicing fees on Class R-S and Class R-D Units as they are accrued on a monthly basis.
(c)Non-Controlling Interests relate to the Parallel Investment Entities’ interest in the Aggregator.
Off-Balance Sheet Arrangements
We do not have any off-balance sheet financings or liabilities other than contractual commitments incurred in the normal course of our business.
Critical Accounting Estimates
The preparation of the financial statements in accordance with accounting principles generally accepted in the United States of America (“GAAP”) involves significant judgments and assumptions and requires estimates about matters that are inherently uncertain. These judgments affect our reported amounts of assets and liabilities and our disclosure of contingent assets and liabilities at the dates of the financial statements and the reported amounts of income and expenses during the reporting periods. With different estimates or assumptions, materially different amounts could be reported in our financial statements. The following is a summary of our significant accounting policies that we believe are the most affected by our judgments, estimates and assumptions.
Fair Value
The Fund’s Investments are valued at fair value in a manner consistent with ASC 820. In general, ASC 820 defines fair value as the price that would be received to sell an asset or paid to transfer a liability in an orderly transaction between market participants at the measurement date (i.e., the exit price). ASC 820 also sets a framework for measuring fair value and requires the inclusion in financial statements of certain disclosures about fair value measurements.
36
Fair Value of Investments or Instruments that are Exchange Traded
Securities that are exchange traded and for which a quoted market exists are valued at the closing price of such securities in the principal market in which the security trades, or in the absence of a principal market, in the most advantageous market on the valuation date. When a quoted price in an active market exists, no block discounts or control premiums are permitted regardless of the size of the public security held. In some cases, securities may include legal restrictions limiting their purchase and sale for a period of time, such as may be required under SEC Rule 144. A discount to a publicly traded price may be appropriate in those cases where a legal restriction is a characteristic of the security. The amount of the discount, if taken, shall be determined based on the time period that must pass before the restricted security becomes unrestricted or otherwise available for sale.
Fair Value of Investments or Instruments that are not Exchange Traded
In the absence of observable market prices, the Fund values its investments using valuation methodologies applied on a consistent basis. For some investments little market activity may exist. The Fund’s determination of fair value is then based on the best information available and may incorporate management’s own assumptions and involve a significant degree of judgment, taking into consideration a combination of internal and external factors. The Fund considers the Fund’s recent purchase transaction value as a strong indicator of fair value and, as such, may continue to carry the investment at its transaction value for the first several reporting periods following the purchase of the investment, absent extraordinary factors. When the Fund determines the fair value, it updates the prior month-end valuation by incorporating latest available data, including values provided by external valuation firms, as well as any cash flow activity related to the investment during the month, updated quarterly financials, where applicable, and market movement.
The Fund’s methodology for determining the fair values of investments in operating companies is a combination of the income approach, market approach, or both. When utilizing the income approach, the Fund generally uses the discounted cash flow method, which relies on the Fund making significant assumptions around projections of future earnings or cash flows, discount rates, capitalization rate, or exit multiple. When utilizing the market approach, the Fund relies upon valuations for comparable public companies, transactions or assets, and thus requires that the Fund uses discretion to identify comparable companies, transactions and assets.
In addition, the Fund may, but is not obligated to, monitor the Fund’s Equity Investments on an ongoing basis for events that the Fund believes may have a material impact on the Fund’s NAV as a whole. Material events may include investment-specific events or broader market-driven events that may impact more than one specific investment. Upon the occurrence of such a material event and provided that the Fund is aware that such event has occurred, the Fund may, but is not obligated to, provide an estimate of the change in value of the Equity Investment, based on the valuation procedures described herein. In general, the Fund expects that any adjustments to fair values will be calculated promptly after a determination that a material change has occurred and the financial effects of such change are quantifiable. However, rapidly changing market conditions or material events may not be immediately reflected in the monthly NAV.
Fair Value of Fund Investments
Investments in affiliated or unaffiliated investee funds (“Investee Funds”) are generally valued using the reported net asset value (“NAV” or “Net Asset Value”) of the Investee Funds as a practical expedient for fair value. The Fund may, as a practical expedient, estimate the fair value of an Investee Fund based on NAV if the reported NAV of the Investee Fund is calculated in a manner consistent with the measurement principles applied to investment companies and T-POP has internal processes to independently evaluate the fair value measurement process utilized by the underlying Investee Fund to calculate the Investee Fund’s NAV, both of which are in accordance with ASC 946. Such internal processes include the evaluation of the Investee Fund’s own process and related internal controls in place to estimate the fair value of its underlying investments that are included in the NAV calculation, performing ongoing operational due diligence, review of the Investee Fund’s financial statements and ongoing monitoring of other relevant qualitative and quantitative factors. If T-POP determines, based on its own due diligence and investment monitoring procedures, that NAV does not represent fair value or if the investee fund is not an investment company, T-POP will estimate the fair value in good faith and in a manner that it reasonably chooses, in accordance with its valuation policies.
37
Debt and Other Securities
The fair values of certain debt positions are generally determined on the basis of prices between market participants provided by reputable dealers or pricing services. In determining the value of a particular investment, pricing services may use certain information with respect to transactions in such investments, quotations from dealers, pricing matrices, market transactions in comparable investments and various relationships between investments. Specifically, for investments in distressed debt and corporate loans and bonds, the Fund generally determines fair value by comparing against similar investments. The Fund reviews and analyzes prices obtained from external pricing sources to evaluate their reliability and accuracy, and at times, exclude vendor prices and broker quotations that the Fund does not believe are representative of fair value. Certain financial instruments may not trade or prices are not readily available, or trade infrequently and, when they are traded, the price may be unobservable and, as a result, multiple external pricing sources may not be available. In such instances, the Fund may use an internal pricing model as either a corroborating or sole data point in determining the price. The Fund generally engages specialized third-party valuation service providers to assess and corroborate the valuation of a selection of the investments on a periodic basis.
Valuation Process
The Fund follows established procedures each month in conducting valuations of the Fund’s investments. The rigor of its procedures is intended to ensure consistent application across investments of U.S. GAAP and its valuation policies. There are three key groups of the Fund professionals engaged in the valuation process. For example, the monthly, quarterly, and annual valuation processes are facilitated and managed by the Fund “Valuation Team” with significant participation from the respective investment-specific “Deal Team” and the Fund’s “Global Valuation Committee” and the respective “Subcommittee” (collectively, the “Valuation Committees”). The following describes the responsibilities of the various parties involved in valuation determinations for Equity Investments:
•An investment-specific Deal Team which is charged generally with monitoring the relevant portfolio company, preparing the valuation analysis, making an initial valuation recommendation to the Fund’s Valuation Team and amending the valuation based on the input from the other participants in the valuation process.
•The Fund Valuation Team, together with an external valuation firm, initiates and manages the valuation process by sending standardized valuation templates and/or valuation surveys to deal teams, review each proposed quarterly valuation for completeness and consistency across periods and the Fund’s portfolio, providing feedback and analysis to the investment-specific Deal Team and the Valuation Committees where appropriate, and administer its valuation policy generally.
•The Valuation Committees reviews a majority of proposed Fund valuations, including the valuation methodology underlying each investment, suggest changes when warranted and give the final approval on all Fund valuations. Each subcommittee comprises senior product and TPG leadership. The valuations are aggregated and significant matters are presented for final approval by the Fund’s global valuation committee, which comprises senior employees. The Valuation Committees also establish a valuation policy and help ensure its consistent application together with the valuation team.
The following describes the responsibilities of the various parties involved in valuation determinations for Debt and Other Securities:
•An investment-specific Deal Team which is charged generally with reviewing policy prices in order to determine if such price is consistent with information currently available to them in the marketplace, and providing an override price if applicable.
•The Fund’s Valuation Team collects, reviews, and analyzes external pricing data before providing a “policy price” to the Deal Team. As part of its analysis, the Fund’s Valuation Team establishes reasonable procedures for testing the reliability and accuracy of the external pricing data it receives. If applicable, the Valuation Team determines whether an override is appropriate, and the group has the authority to accept or reject an override.
38
•The Valuation Committees oversee the valuation process and reviews and approves any exceptions. Each Sub Committee comprises senior product and TPG leadership. The valuations are aggregated and significant matters are presented for final approval by the Fund’s Global Valuation Committee, which comprises senior employees. The Valuation Committees also establish a valuation policy and help ensure its consistent application together with the Valuation Team.
The Fund also engages independent third parties to review its periodic valuations, as well as advise on valuation policy more generally. When making fair value determinations for assets that do not have a reliable, readily available market price, the Fund engages one or more independent valuation firms to perform certain procedures to assess if its fair value estimates are reasonable as of the relevant measurement date.
Servicing Fees
Pursuant to the Dealer Manager Agreement entered into between T-POP, the Feeder TE and TPG Capital BD, LLC (the “Dealer Manager”), T-POP or its affiliates will pay to the Dealer Manager a Servicing Fee in the amount of (a) 0.85% per annum of the aggregate NAV for the Class S Units and Class R-S Units as of the last day of each month and (b) 0.25% per annum of the aggregate NAV for the Class D Units and Class R-D Units as of the last day of each month, in each case, payable monthly. T-POP or its affiliates will not pay to the Dealer Manager a Servicing Fee in respect of the purchase of any Class I Units, Class R-I Units and Class F Units. In calculating the Servicing Fee, the T-POP will use its NAV before giving effect to any accruals for the Servicing Fee, repurchases for that month, if any, and distributions payable on the T-POP Units.
Under GAAP, T-POP accrues the cost of the Servicing Fees, as applicable, for the estimated life of the Units as an offering cost at the time we sell Class S Units, Class R-S Units, Class D Units, and Class R-D Units. Inherent in the calculation of the estimated amount of Servicing Fees to be paid in future periods are certain significant management judgments and estimates, including the estimated life of the Units at the time of a subscription. Servicing Fees Payable entails uncertainties as the calculation requires management to make assumptions and to apply judgment regarding a number of factors, including market conditions, the selling environment and historical trends. As of September 30, 2025, T-POP has accrued $6.7 million of Servicing Fees Payable to TPG Capital BD, LLC, related to the Class R-S and Class R-D Units sold.
Recent Accounting Pronouncements
There were no accounting pronouncements issued during the three months ended September 30, 2025 that are expected to have a material impact on our condensed consolidated financial statements included in this Quarterly Report on Form 10-Q.
Item 3. Quantitative and Qualitative Disclosures About Market Risk.
The Fund is subject to financial market risks, including changes in interest rates. The Fund plans to invest primarily in Equity Investments. Most of the Fund’s investments do not have a readily available market price, and the Fund values these investments at fair value as determined in good faith pursuant to procedures adopted by, and under the oversight of, the Board in accordance with the Fund’s valuation policy. There is no single standard for determining fair value in good faith. As a result, determining fair value requires that judgment be applied to the specific facts and circumstances of each portfolio investment while employing a consistently applied valuation process for the types of investments the Fund makes. See “Item 9. Market Price of and Dividends on the Registrant’s Common Equity and Related Limited Partner Matters—Calculation of Net Asset Value” in our Form 10 Registration Statement.
Fair Value Risk
T-POP holds investments, all of which are reported at fair value. Determining fair value requires that judgment be applied to the specific facts and circumstances of each portfolio investment while employing a consistently applied valuation process for the types of investments made by T-POP. Net changes in the fair value of portfolio companies impact the net increase or decrease in net assets resulting from operations in our condensed consolidated statements of operations. Based on investments held as of September 30, 2025, we estimate that an immediate, hypothetical 10% decline in the fair
39
value of investments would result in a decline in net increase in net assets resulting from operations of $54.6 million, if not offset by other factors.
Exchange Rate Risk
T-POP holds investments that are denominated in non-U.S. dollar currencies that may be affected by movements in the rate of exchange between the U.S. dollar and non-U.S. dollar currencies. T-POP manages exposure to investments in foreign currencies by hedging such risks. As September 30, 2025, T-POP held foreign currency contracts to hedge a change in exchange rates against the U.S. dollar. We estimate that as of September 30, 2025, a 10% decline in the exchange rates between the U.S. dollar and all other foreign currencies in which certain portfolio companies are denominated would result in a decline in net assets resulting from operations of $9.4 million, if not offset by other factors.
Interest Rate Risk
Changes in credit markets and in particular, interest rates, can impact investment valuations and may have offsetting results depending on the valuation methodology used. For example, we may use a discounted cash flow analysis as one of the methodologies to ascertain the fair value of our portfolio companies that do not have readily observable market prices. If applicable interest rates rise, then the assumed cost of capital for those portfolio companies would be expected to increase under the discounted cash flow analysis, and this effect would negatively impact their valuations if not offset by other factors. Conversely, a fall in interest rates can positively impact valuations of certain portfolio companies if not offset by other factors. These impacts could be substantial depending upon the magnitude of the change in interest rates. Finally, low interest rates related to monetary stimulus and economic stagnation may also negatively impact expected returns on all investments, as the demand for relatively higher return assets increases and supply decreases. Additionally, with respect to our business operations, general increases in interest rates over time may cause the interest expense associated with our borrowings to increase and the value of our fixed income investments to decline. Conversely, general decreases in interest rates over time may cause the interest expense associated with our borrowings to decrease, and the value of our fixed income investments to increase. As of September 30, 2025, T-POP does not have any outstanding borrowings.
Item 4. Controls and Procedures.
Evaluation of Disclosure Controls and Procedures
We maintain disclosure controls and procedures (as that term is defined in Rules 13a-15(e) and 15d-15(e) under the Exchange Act) that are designed to ensure that information required to be disclosed in the Registrant’s reports under the Exchange Act is recorded, processed, summarized and reported within the time periods specified in the SEC’s rules and forms, and that such information is accumulated and communicated to management, including our Chief Executive Officer and Chief Financial Officer, as appropriate, to allow timely decisions regarding required disclosures. Any controls and procedures, no matter how well designed and operated, can provide only reasonable assurance of achieving the desired control objectives.
Our management, including our Chief Executive Officer and Chief Financial Officer, evaluated the effectiveness of our disclosure controls and procedures pursuant to Rule 13a‐15 under the Exchange Act as of the end of the period covered by this report. Based on that evaluation, our Chief Executive Officer and Chief Financial Officer have concluded that, as of the end of the period covered by this report, our disclosure controls and procedures (as defined in Rule 13a‐15(e) under the Exchange Act) are effective at the reasonable assurance level to accomplish their objectives of ensuring that information we are required to disclose in reports that we file or submit under the Exchange Act is recorded, processed, summarized and reported within the time periods specified in the SEC rules and forms, and that such information is accumulated and communicated to our management, including our Chief Executive Officer and Chief Financial Officer, as appropriate, to allow timely decisions regarding required disclosure.
Changes in Internal Controls over Financial Reporting
There have been no changes in our internal control over financial reporting (as such term is defined in Rules 13a-15(f) and 15d-15(f) under the Exchange Act) that occurred during the quarter ended September 30, 2025 that have materially affected, or are reasonably likely to materially affect, our internal control over financial reporting.
40
PART II – OTHER INFORMATION
Item 1. Legal Proceedings.
Neither the Registrant, the General Partner nor the Management Company are currently subject to any pending material legal proceedings against the Registrant, the General Partner or the Management Company. From time to time, the Registrant, the General Partner or the Management Company may be a party to certain legal proceedings in the ordinary course of business, including proceedings relating to the enforcement of the Registrant’s rights under contracts with the Registrant’s portfolio companies. The Registrant may also be subject to regulatory proceedings. See Note 4. “Commitments and Contingencies” in our financial statements included in this Quarterly Report on Form 10-Q.
Item 1A. Risk Factors.
For a discussion of our potential risks and uncertainties, see the information under the heading “Risk Factors” in our Form 10 Registration Statement and our Quarterly Report on Form 10-Q for the quarter ended March 31, 2025. There have been no material changes from the risk factors previously disclosed. The risks described in our Form 10 Registration Statement and our Quarterly Report on Form 10-Q for the quarter ended March 31, 2025 are not the only risks facing us. Additional risks and uncertainties not currently known to us or that we currently deem to be immaterial also may materially adversely affect our business, financial condition and/or operating results.
Item 2. Unregistered Sales of Equity Securities and Use of Proceeds.
None.
Item 3. Defaults Upon Senior Securities.
None.
Item 4. Mine Safety Disclosures.
Not applicable.
Item 5. Other Information.
41
Item 6. Exhibits.
| Exhibit No. | Description | |||||||
| 3.1 | ||||||||
| 3.2 | ||||||||
| 4.1 | ||||||||
| 10.1 | ||||||||
31.1* | ||||||||
31.2* | ||||||||
32.1* | ||||||||
32.2* | ||||||||
| 101.INS | Inline XBRL Instance Document – the instance document does not appear in the Interactive Data File because its XBRL tags are embedded within the Inline XBRL document. | |||||||
| 101.SCH | Inline XBRL Taxonomy Extension Schema Document. | |||||||
| 101.CAL | Inline XBRL Taxonomy Extension Calculation Linkbase Document. | |||||||
| 101.DEF | Inline XBRL Taxonomy Extension Definition Linkbase Document. | |||||||
| 101.LAB | Inline XBRL Taxonomy Extension Label Linkbase Document. | |||||||
| 101.PRE | Inline XBRL Taxonomy Extension Presentation Linkbase Document. | |||||||
| 104 | Cover Page Interactive Data File (embedded within the Inline XBRL document). | |||||||
___________________
* Filed herewith.
42
SIGNATURES
Pursuant to the requirements of the Securities Exchange Act of 1934, the registrant has duly caused his report to be signed on its behalf by the undersigned thereunto duly authorized.
| TPG Private Equity Opportunities, L.P. | ||||||||
| November 13, 2025 | By: | /s/ Jack Weingart | ||||||
Name: Jack Weingart | ||||||||
Title: Chief Executive Officer (Principal Executive Officer) | ||||||||
| By: | /s/ Matt White | |||||||
| Name: Matt White | ||||||||
Title: Chief Financial Officer (Principal Financial and Accounting Officer) | ||||||||
43
Exhibit 31.1
I, Jack Weingart, certify that:
1.I have reviewed this Quarterly Report on Form 10-Q for the quarter ended September 30, 2025 of TPG Private Equity Opportunities, L.P. (the “registrant”);
2.Based on my knowledge, this report does not contain any untrue statement of a material fact or omit to state a material fact necessary to make the statements made, in light of the circumstances under which such statements were made, not misleading with respect to the period covered by this report;
3.Based on my knowledge, the financial statements, and other financial information included in this report, fairly present in all material respects the financial condition, results of operations and cash flows of the registrant as of, and for, the periods presented in this report;
4.The registrant’s other certifying officer and I are responsible for establishing and maintaining disclosure controls and procedures (as defined in Exchange Act Rules 13a-15(e) and 15d-15(e)) for the registrant and have:
a)Designed such disclosure controls and procedures, or caused such disclosure controls and procedures to be designed under our supervision, to ensure that material information relating to the registrant, including its consolidated subsidiaries, is made known to us by others within those entities, particularly during the period in which this report is being prepared;
b)[Omitted];
c)Evaluated the effectiveness of the registrant’s disclosure controls and procedures and presented in this report our conclusions about the effectiveness of the disclosure controls and procedures, as of the end of the period covered by this report based on such evaluation; and
d)Disclosed in this report any change in the registrant’s internal control over financial reporting that occurred during the registrant’s most recent fiscal quarter (the registrant’s fourth fiscal quarter in the case of an annual report) that has materially affected, or is reasonably likely to materially affect, the registrant’s internal control over financial reporting; and
5.The registrant’s other certifying officer and I have disclosed, based on our most recent evaluation of internal control over financial reporting, to the registrant’s auditors and the audit committee of the registrant’s board of directors (or persons performing the equivalent functions):
a)All significant deficiencies and material weaknesses in the design or operation of internal control over financial reporting which are reasonably likely to adversely affect the registrant’s ability to record, process, summarize and report financial information; and
b)Any fraud, whether or not material, that involves management or other employees who have a significant role in the registrant’s internal control over financial reporting.
Date: November 13, 2025
| /s/ Jack Weingart | ||
| Jack Weingart | ||
| Chief Executive Officer | ||
Exhibit 31.2
I, Matt White, certify that:
1.I have reviewed this Quarterly Report on Form 10-Q for the quarter ended September 30, 2025 of TPG Private Equity Opportunities, L.P. (the “registrant”);
2.Based on my knowledge, this report does not contain any untrue statement of a material fact or omit to state a material fact necessary to make the statements made, in light of the circumstances under which such statements were made, not misleading with respect to the period covered by this report;
3.Based on my knowledge, the financial statements, and other financial information included in this report, fairly present in all material respects the financial condition, results of operations and cash flows of the registrant as of, and for, the periods presented in this report;
4.The registrant’s other certifying officer and I are responsible for establishing and maintaining disclosure controls and procedures (as defined in Exchange Act Rules 13a-15(e) and 15d-15(e)) for the registrant and have:
a)Designed such disclosure controls and procedures, or caused such disclosure controls and procedures to be designed under our supervision, to ensure that material information relating to the registrant, including its consolidated subsidiaries, is made known to us by others within those entities, particularly during the period in which this report is being prepared;
b)[Omitted];
c)Evaluated the effectiveness of the registrant’s disclosure controls and procedures and presented in this report our conclusions about the effectiveness of the disclosure controls and procedures, as of the end of the period covered by this report based on such evaluation; and
d)Disclosed in this report any change in the registrant’s internal control over financial reporting that occurred during the registrant’s most recent fiscal quarter (the registrant’s fourth fiscal quarter in the case of an annual report) that has materially affected, or is reasonably likely to materially affect, the registrant’s internal control over financial reporting; and
5.The registrant’s other certifying officer and I have disclosed, based on our most recent evaluation of internal control over financial reporting, to the registrant’s auditors and the audit committee of the registrant’s board of directors (or persons performing the equivalent functions):
a)All significant deficiencies and material weaknesses in the design or operation of internal control over financial reporting which are reasonably likely to adversely affect the registrant’s ability to record, process, summarize and report financial information; and
b)Any fraud, whether or not material, that involves management or other employees who have a significant role in the registrant’s internal control over financial reporting.
Date: November 13, 2025
| /s/ Matt White | ||
| Matt White | ||
| Chief Financial Officer | ||
Exhibit 32.1
CERTIFICATION BY THE CHIEF EXECUTIVE OFFICER
PURSUANT TO 18 U.S.C. SECTION 1350,
AS ADOPTED PURSUANT TO SECTION 906 OF THE SARBANES-OXLEY ACT OF 2002
In connection with the Quarterly Report on Form 10-Q of TPG Private Equity Opportunities, L.P. (the “Company”) for the quarter ended September 30, 2025 as filed with the Securities and Exchange Commission on the date hereof (the “Report”), I, Jack Weingart, Chief Executive Officer of the Company, hereby certify, pursuant to 18 U.S.C. Section 1350, as adopted pursuant to Section 906 of the Sarbanes-Oxley Act of 2002, that to my knowledge:
(1)The Report fully complies with the requirements of Section 13(a) or 15(d) of the Securities Exchange Act of 1934, as amended; and
(2)The information contained in the Report fairly presents, in all material respects, the financial condition and results of operations of the Company.
This certificate is being furnished solely for the purposes of 18 U.S.C. Section 1350 and is not being filed as part of the Report or as a separate disclosure document.
Date: November 13, 2025
| /s/ Jack Weingart | ||
| Jack Weingart | ||
| Chief Executive Officer | ||
Exhibit 32.2
CERTIFICATION BY THE CHIEF FINANCIAL OFFICER
PURSUANT TO 18 U.S.C. SECTION 1350,
AS ADOPTED PURSUANT TO SECTION 906 OF THE SARBANES-OXLEY ACT OF 2002
In connection with the Quarterly Report on Form 10-Q of TPG Private Equity Opportunities, L.P. (the “Company”) for the quarter ended September 30, 2025 as filed with the Securities and Exchange Commission on the date hereof (the “Report”), I, Matt White, Chief Financial Officer of the Company, hereby certify, pursuant to 18 U.S.C. Section 1350, as adopted pursuant to Section 906 of the Sarbanes-Oxley Act of 2002, that to my knowledge:
(1)The Report fully complies with the requirements of Section 13(a) or 15(d) of the Securities Exchange Act of 1934, as amended; and
(2)The information contained in the Report fairly presents, in all material respects, the financial condition and results of operations of the Company.
This certificate is being furnished solely for the purposes of 18 U.S.C. Section 1350 and is not being filed as part of the Report or as a separate disclosure document.
Date: November 13, 2025
| /s/ Matt White | ||
| Matt White | ||
| Chief Financial Officer | ||